NIFTY 50 — 22 October 2026
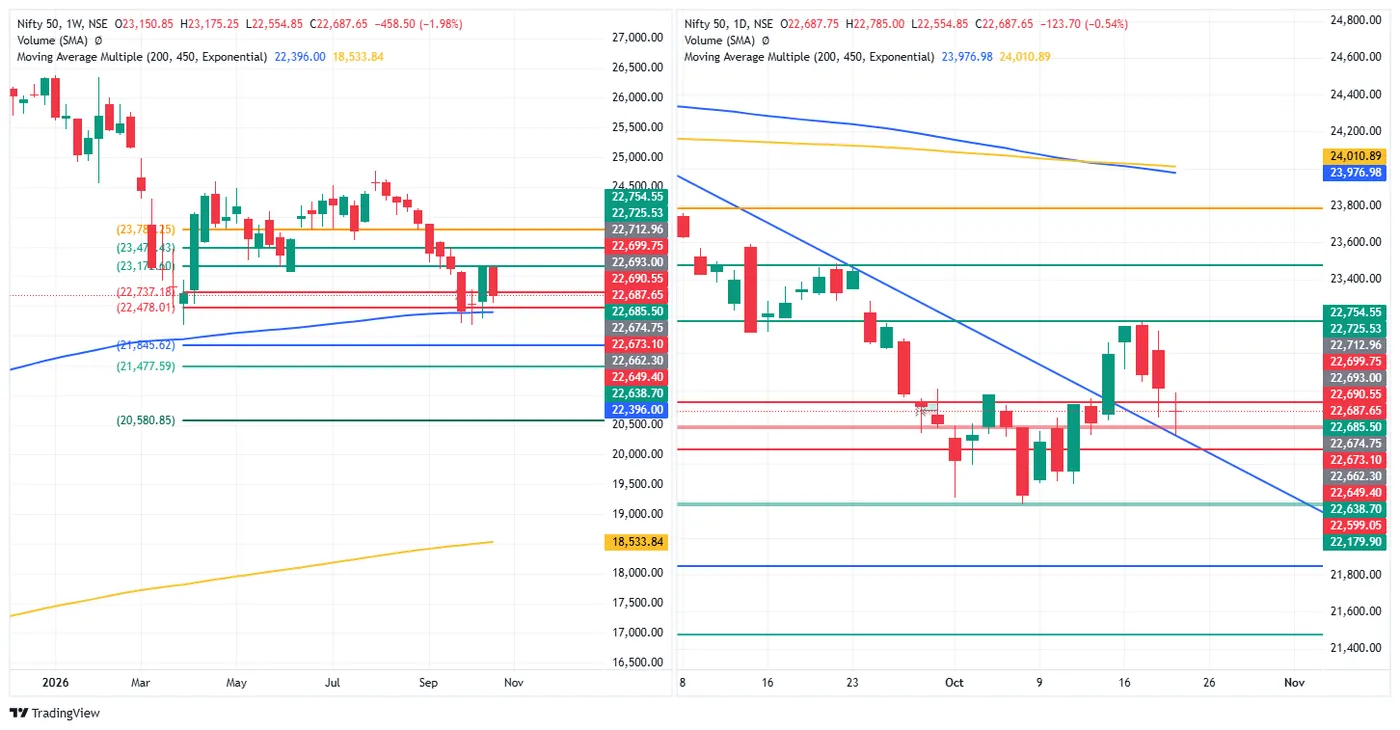
Close 22,687.65, down 123.70 (−0.54%), open 22,687.75, high 22,785.00, low 22,554.85.
A doji after a gap down. The open was 123.60 below Wednesday's close, and the close was 0.10 under the open. In between the index went 97.25 above the open and 132.90 below it, and closed at 57.7% of a 230.15-point range — the narrowest range of the week.
First close below the weekly mark this week. The close is 49.53 below the weekly mark at 22,737.18. On the daily chart the low reached the falling trendline that price crossed on 15 October and went slightly under it (read off the chart). The daily mark at 22,599.05 is 88.60 below, and 22,179.90 below that.
The week so far: −1.98% (−458.50), high 23,175.25, low 22,554.85, close at 21.4% of the week's range. That is 88% of Thursday and Friday's 523.45-point gain from last week.
The 200-week average. 291.65 above the 200-week EMA (22,396.00), 1.30%, from 1.85% on Wednesday. The low was 158.85 above it.
SENSEX — 22 October 2026
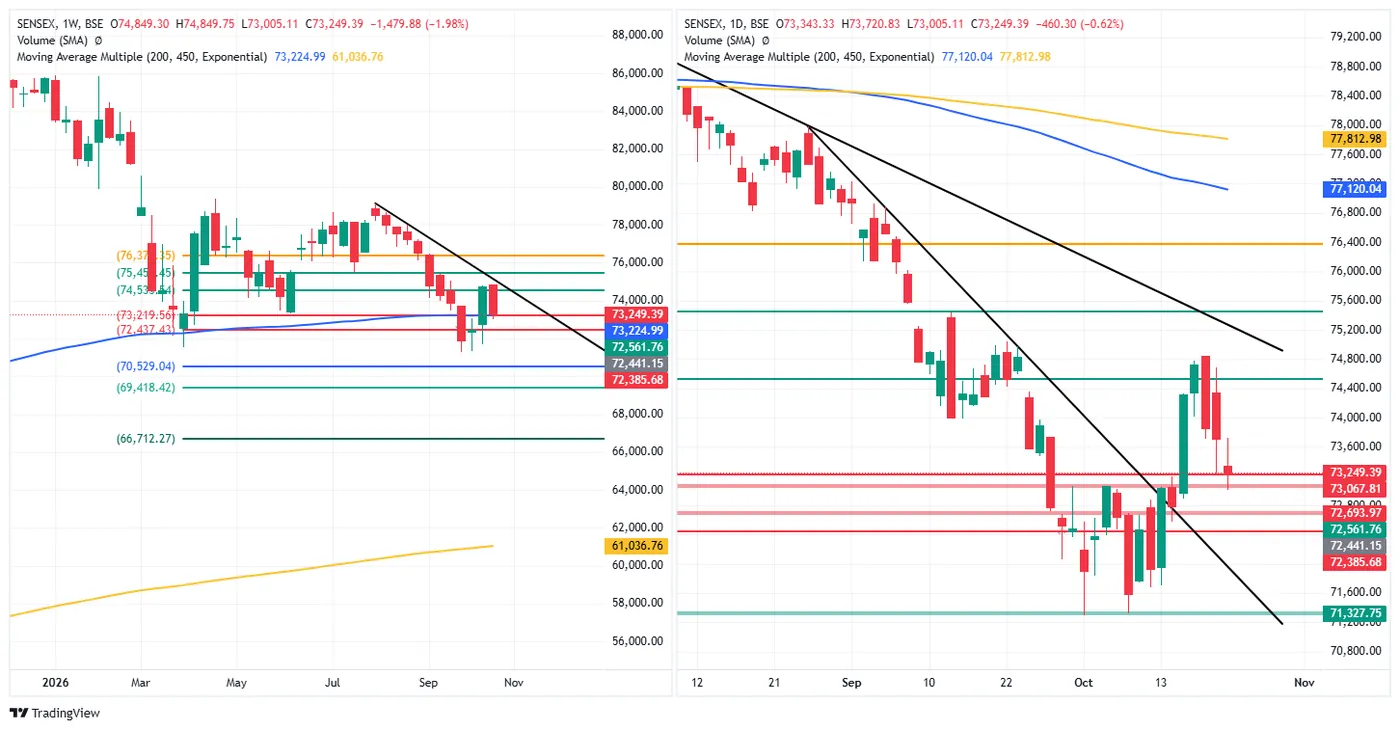
Close 73,249.39, down 460.30 (−0.62%), open 73,343.33, high 73,720.83, low 73,005.11.
Through the 200-week EMA, closed on it. Wednesday's low stopped 0.04 above the 200-week EMA. Thursday's low went 219.88 below it (73,224.99) and the close came back to 24.40 above it — 0.03%.
Also through the daily mark. The low went 62.70 under the daily mark at 73,067.81; the close is 181.58 above it. The open was 366.36 below Wednesday's close and the close is at 34.1% of the day's range.
The week so far: −1.98% (−1,479.88), high 74,849.75, low 73,005.11, close at 13.2% of the week's range — 76% of Thursday and Friday's 1,947.38 from last week. Further daily marks: 72,693.97 and 71,327.75.
BANK NIFTY — 22 October 2026
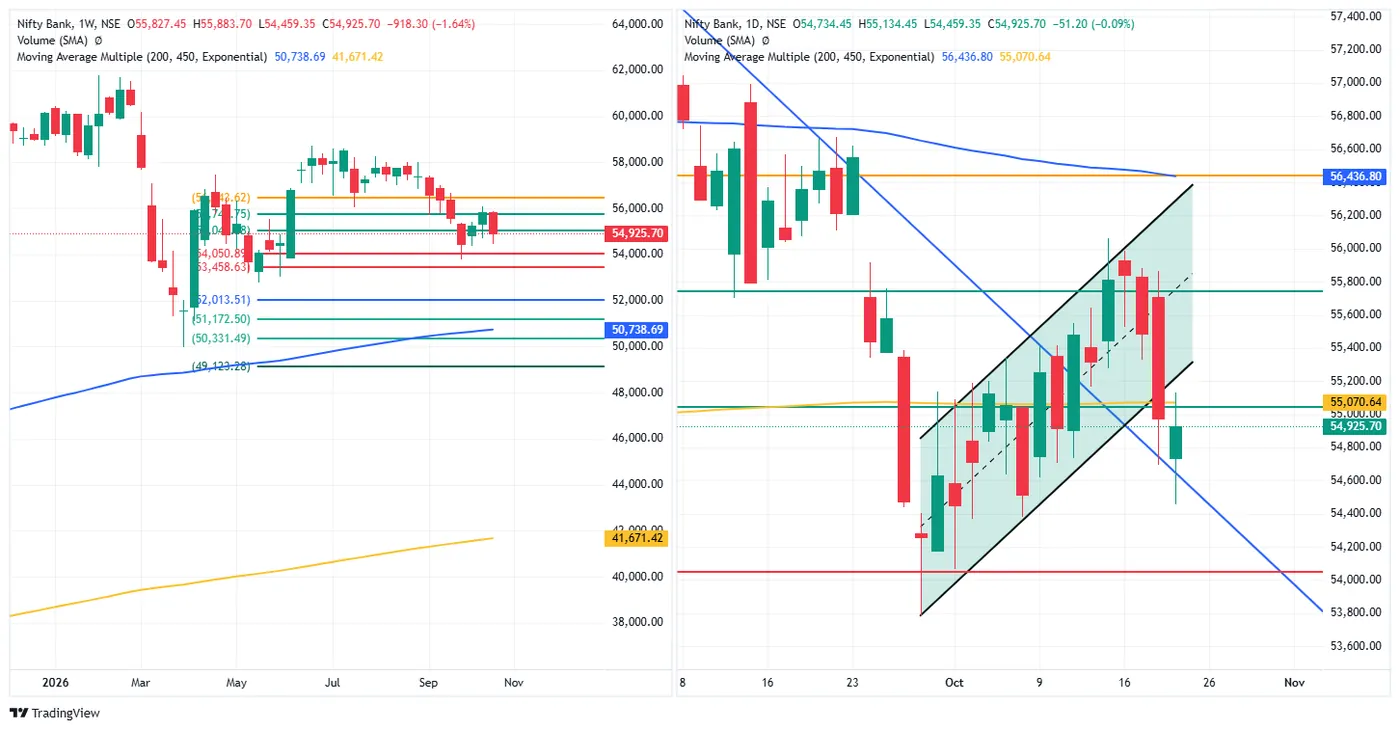
Close 54,925.70, down 51.20 (−0.09%), open 54,734.45, high 55,134.45, low 54,459.35 — the smallest fall of the day.
Gap down, then a green candle. The open was 242.45 below Wednesday's close. The low reached the falling trendline from mid-September (read off the chart) and the index closed 191.25 above its open, at 69.1% of the day's range.
Up to the 450-day EMA and back. The high went 63.81 above the 450-day EMA (55,070.64); the close is 144.94 below it. Wednesday's break below the rising channel was not reversed — the channel's lower line is above the high (read off the chart).
The week so far: −1.64% (−918.30). Weekly marks: about 55,040 above (label partly hidden), 54,050.89 below (874.81 under the close). 200-week EMA 50,738.69.
NIFTY FIN SERVICE — 22 October 2026
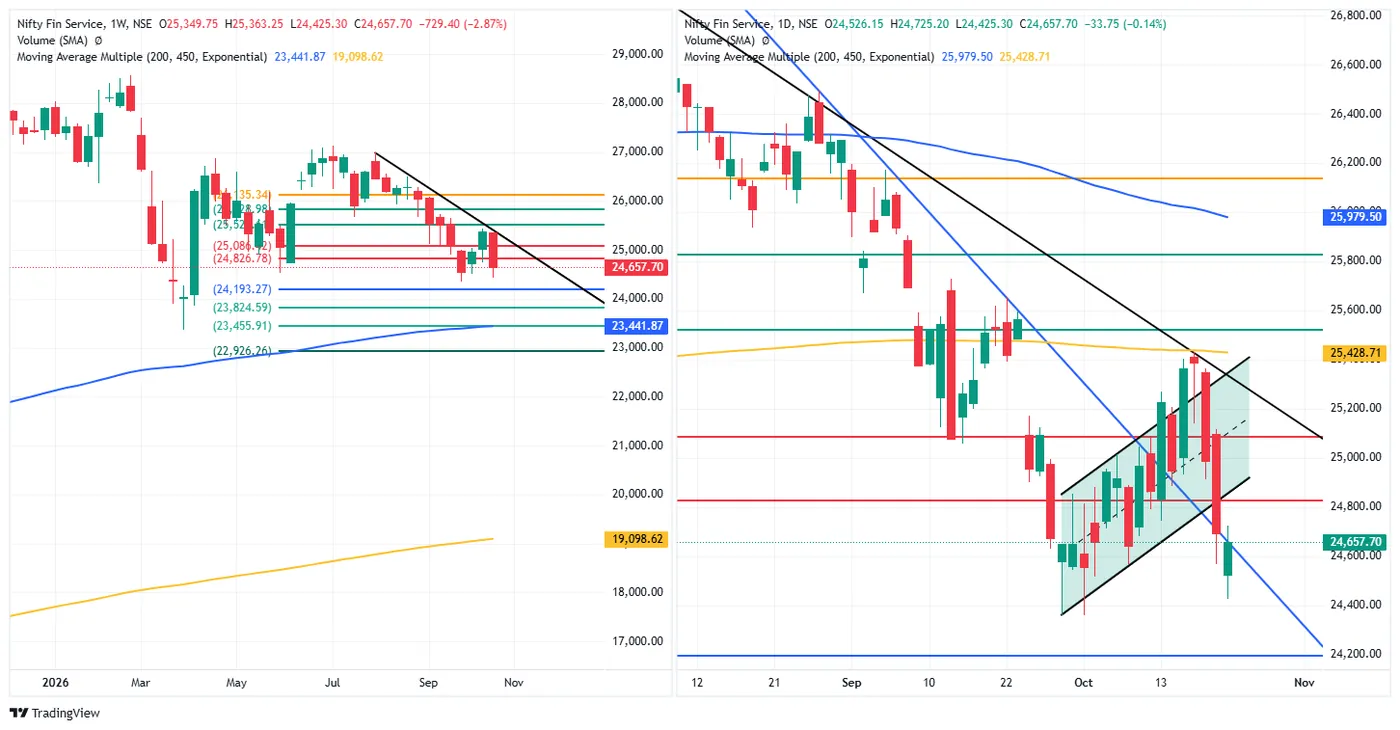
Close 24,657.70, down 33.75 (−0.14%), open 24,526.15, high 24,725.20, low 24,425.30.
The strongest close in its range. After opening 165.30 below Wednesday's close, the index closed 131.55 above its open, at 77.5% of the day's range — the highest close position of the equity indices. The low was on the falling trendline from late August (read off the chart).
Still under the weekly mark. The close is 169.08 below 24,826.78 and 464.43 above 24,193.27. The rising channel that broke on Wednesday is above (read off the chart).
The week so far: −2.87% (−729.40), high 25,363.25, low 24,425.30. 200-week EMA 23,441.87.
NIFTY MIDCAP SELECT — 22 October 2026
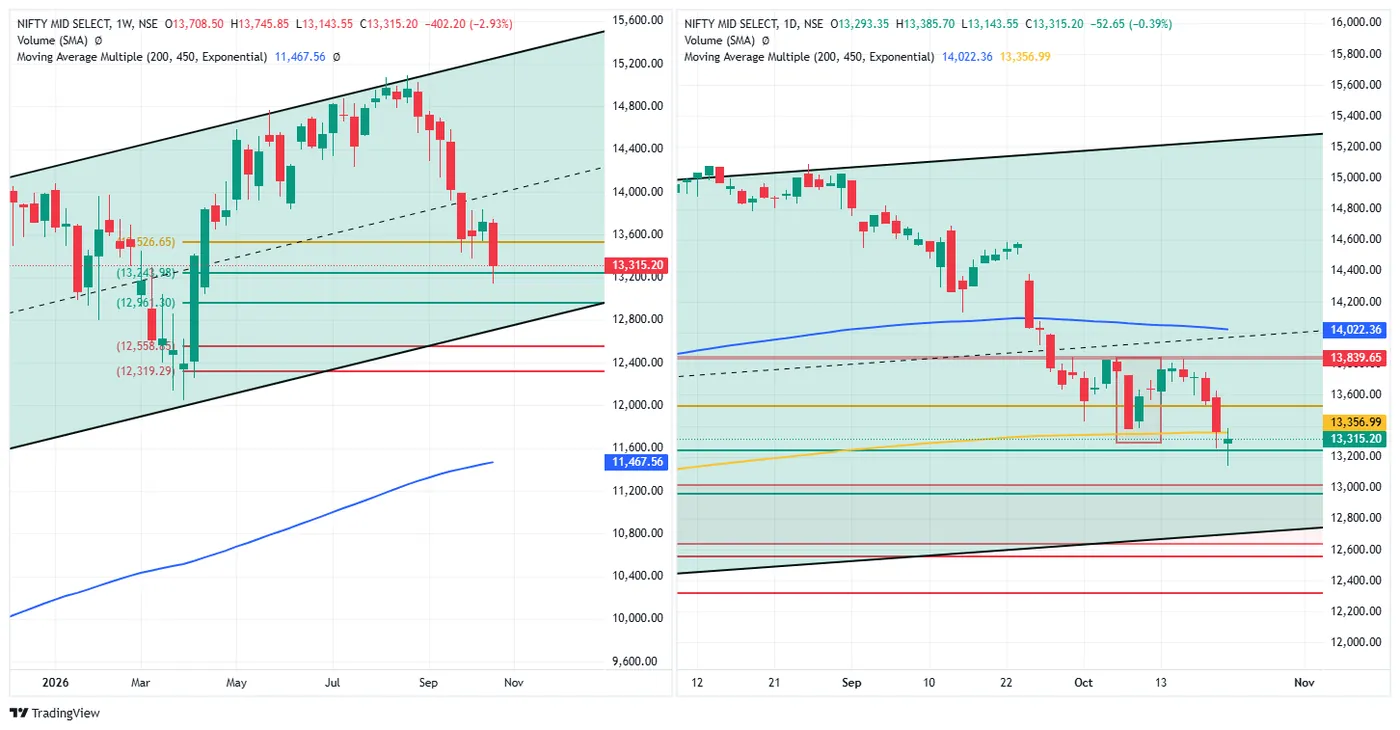
Close 13,315.20, down 52.65 (−0.39%), open 13,293.35, high 13,385.70, low 13,143.55.
Through the next weekly mark and back. Wednesday's low stopped 9.67 above the weekly mark at 13,243.98. Thursday's low went 100.43 below it, and the close is 71.22 above it, at 70.9% of the day's range.
Below the 450-day EMA. The close is 41.79 under the 450-day EMA (13,356.99); the high went 28.71 above it. Wednesday closed 11.51 above it.
The week so far: −2.93% (−402.20), the largest weekly fall of the equity indices; high 13,745.85, low 13,143.55. The weekly mark at 13,526.65 is 211.45 above. Below: 12,961.30, and the weekly channel's lower line near 12,750 (read off the chart).
INDIA VIX — 22 October 2026
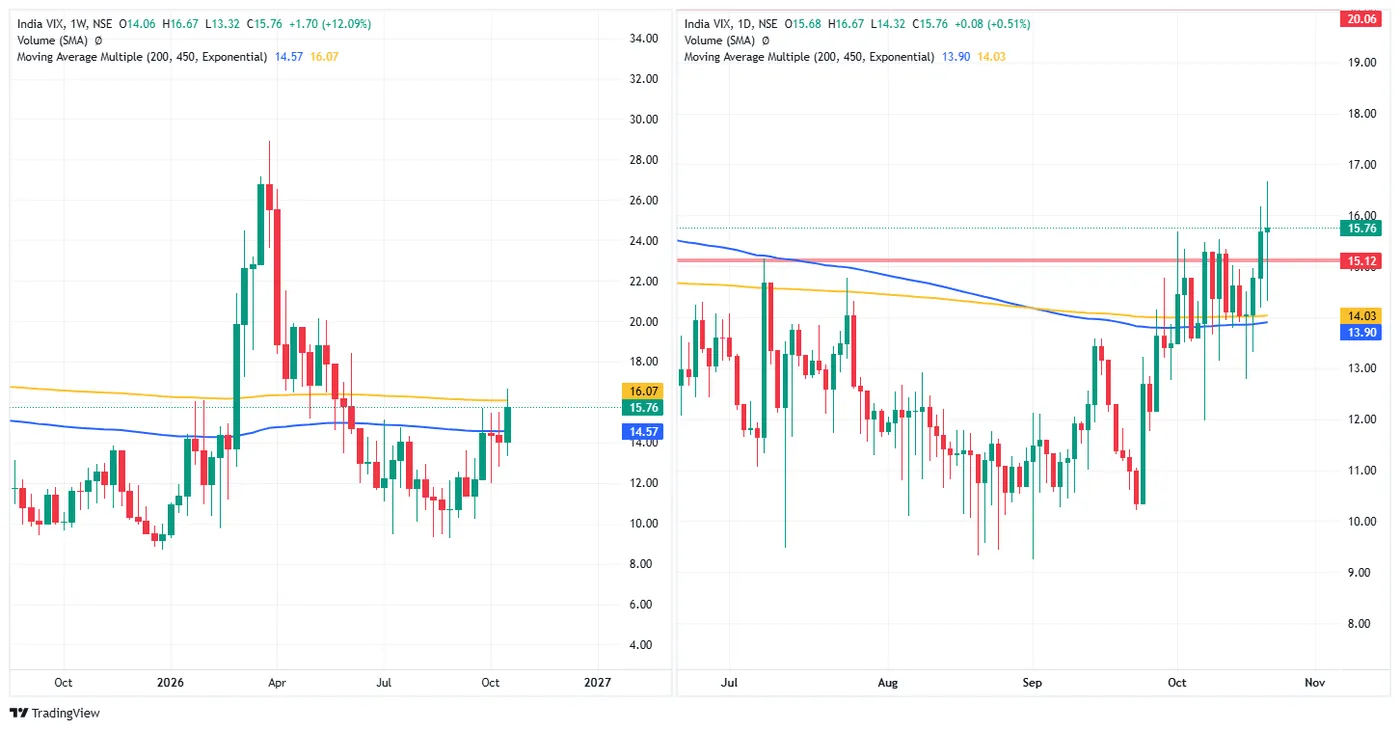
Close 15.76, up 0.08 (+0.51%), open 15.68, high 16.67, low 14.32.
Wide range, little change. VIX moved 2.35 points within the day — up to 16.67 and down to 14.32 — and closed 0.08 above Wednesday. The close is 0.64 above the 15.12 band.
The week so far: +12.09% (+1.70), high 16.67, low 13.32. On the weekly chart the high went 0.60 above the 450-week EMA (16.07) and the close is 0.31 under it; the 200-week EMA (14.57) is 1.19 below. The next band on the daily chart is 20.06.
CRUDE OIL (MCX, 19 Nov fut) — 22 October 2026, evening session
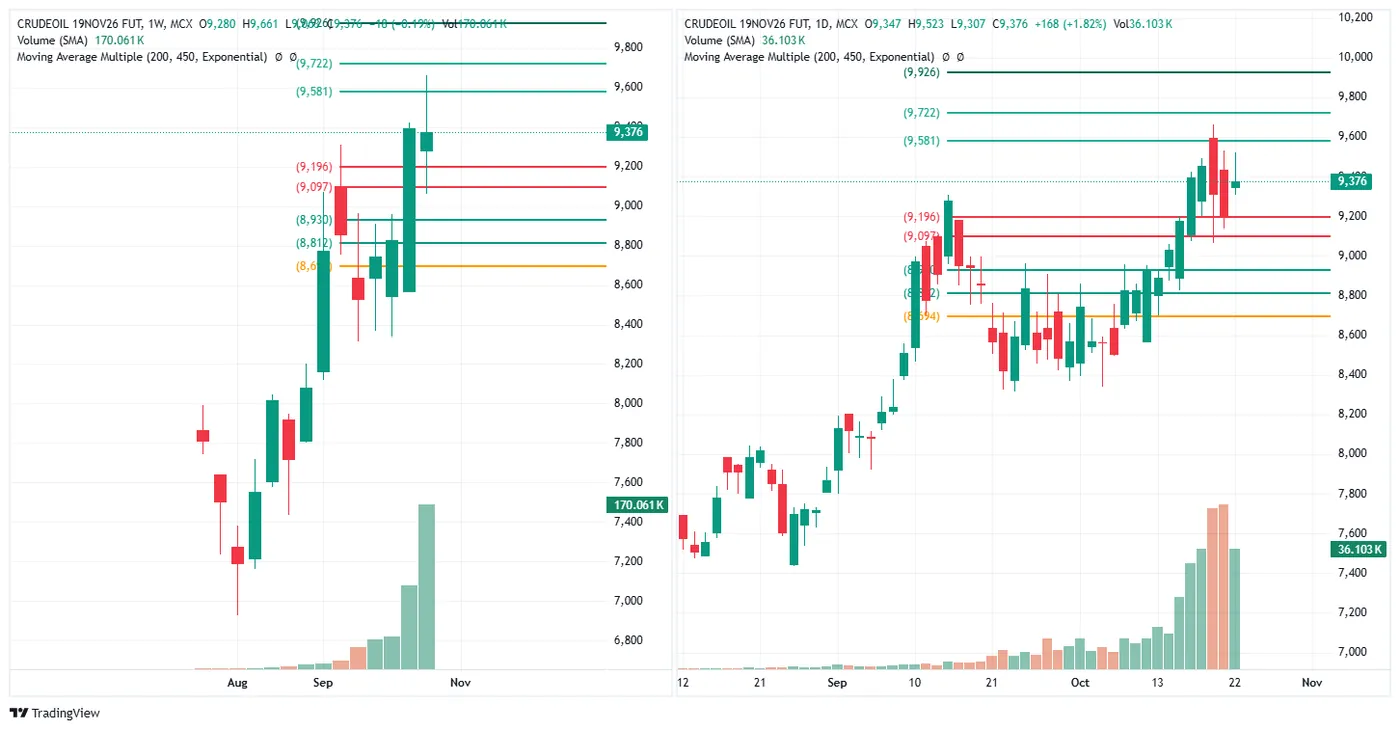
At the time of the chart (session in progress, volume 36.103K): 9,376, up 168 (+1.82%), open 9,347, high 9,523, low 9,307.
Back above 9,196. Wednesday closed on the 9,196 mark. Thursday's low stayed 111 above it and price is 180 above it. The mark at 9,581 is 205 above; Thursday's high was 58 short of it.
The week so far: −0.19% (−18), high 9,661, low 9,063. Further marks: 9,722 and 9,926 above; 9,097 and the September range marks near 8,930, 8,812 and 8,694 below.
GOLD (MCX, 4 Dec fut) — 22 October 2026, evening session
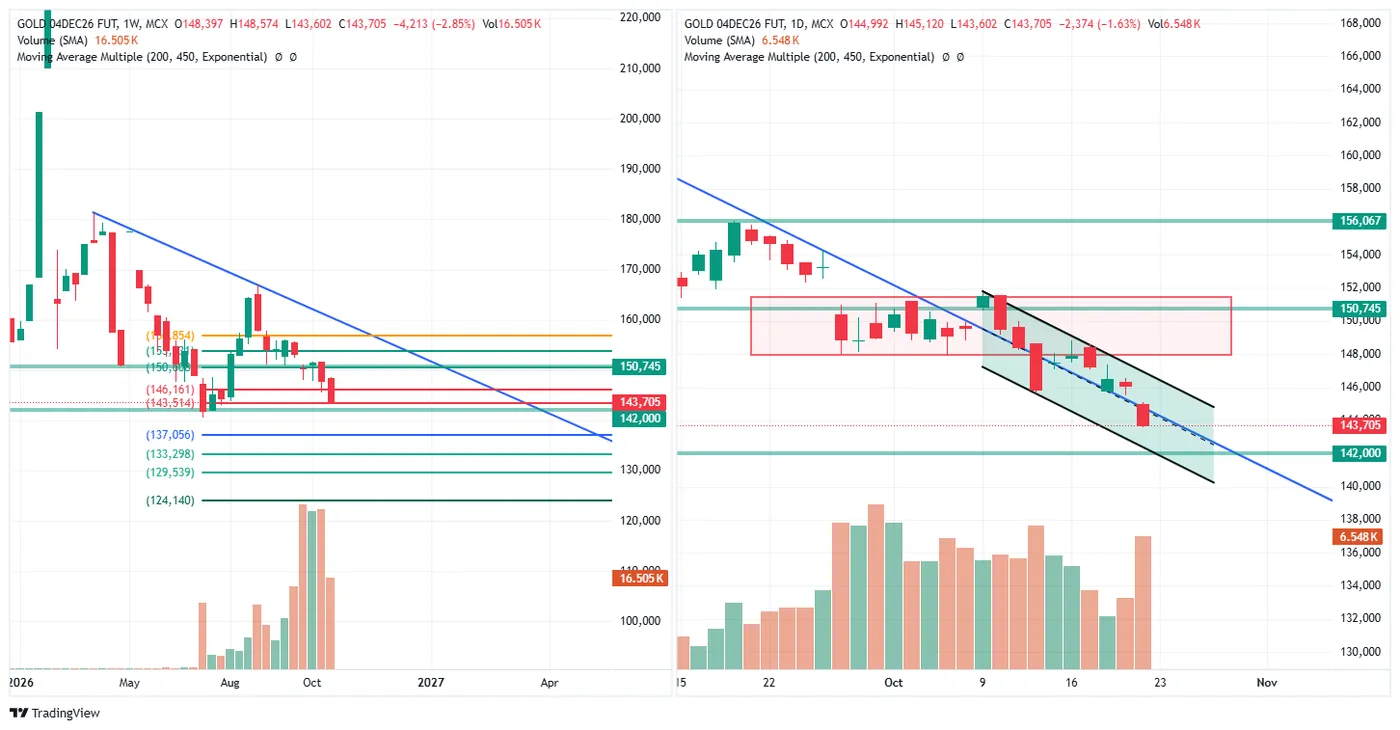
At the time of the chart (session in progress, volume 6.548K): 143,705, down 2,374 (−1.63%), open 144,992, high 145,120, low 143,602 — trading near the low, at 6.8% of the day's range so far.
Lower in the falling channel. The channel drawn from the 9 October high (read off the chart) holds price; Thursday's candle is on the falling trendline from late August, near the channel's midline.
Weekly marks. 143,514 is 191 below, then 142,000 (1,705 below) and 137,056. Above: 146,161, then 150,745. The week so far: −2.85% (−4,213), high 148,574, low 143,602. Thursday's volume so far is the highest since mid-October on the daily chart.
SILVER (MCX, 4 Dec fut) — 22 October 2026, evening session
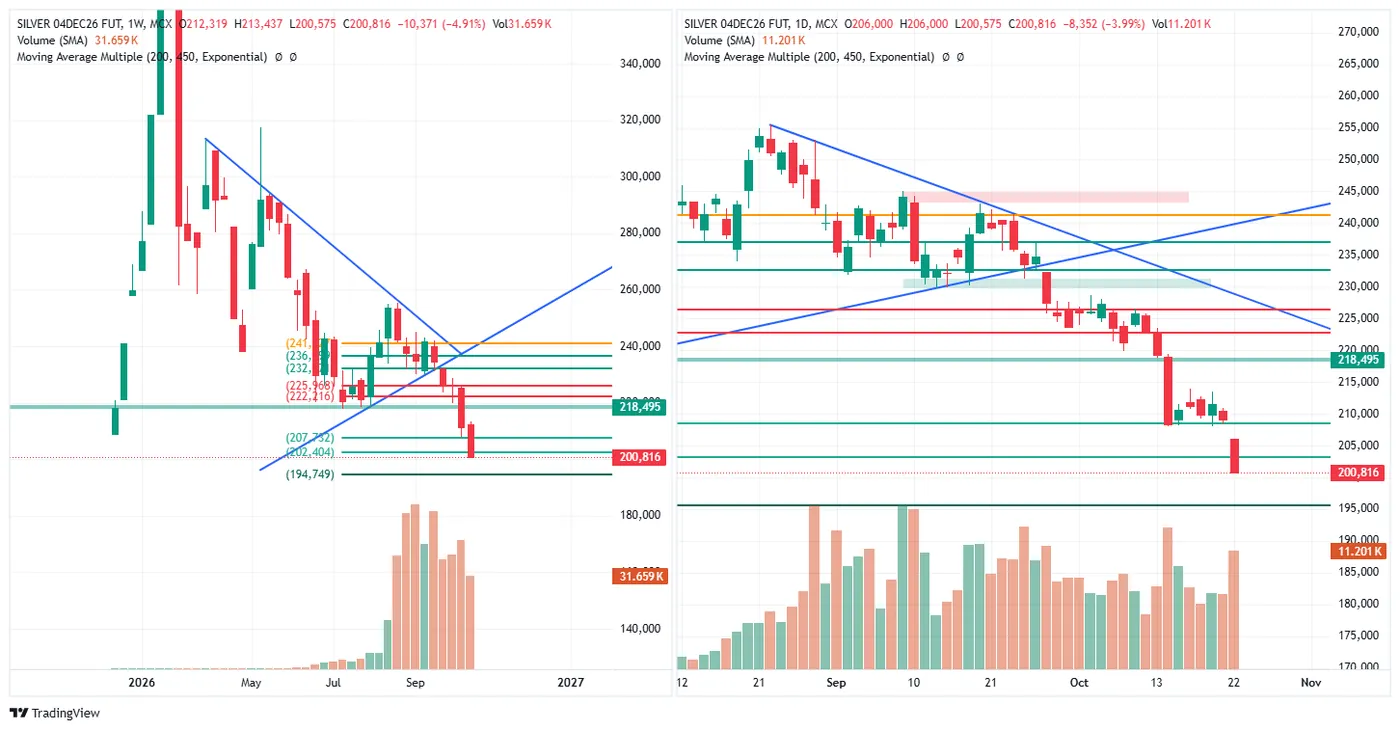
At the time of the chart (session in progress, volume 11.201K): 200,816, down 8,352 (−3.99%), open 206,000, high 206,000, low 200,575 — the open was the high, and price is 241 above the low.
The mark gave way. The daily mark near 208,441, which held the closes from 14 to 21 October, is now 7,625 above. The open was 3,168 under Wednesday's close, so the mark was not traded today.
Weekly marks. The weekly chart marks 207,732 and 202,404 above (price is 1,588 under the second) and 194,749 below, 6,067 away. The week so far: −4.91% (−10,371), high 213,437, low 200,575. Thursday's volume so far is the highest since 14 October on the daily chart.
Read across the session
| Thursday | Closed in its range | Week so far | Note | |
|---|---|---|---|---|
| Bank Nifty | −0.09% | 69.1% | −1.64% | green candle; high touched 450-day EMA |
| Nifty Fin Service | −0.14% | 77.5% | −2.87% | green candle; low on falling trendline |
| Nifty Midcap Select | −0.39% | 70.9% | −2.93% | low 100 under weekly mark, closed above |
| Nifty 50 | −0.54% | 57.7% | −1.98% | doji; first close below weekly mark |
| Sensex | −0.62% | 34.1% | −1.98% | closed 24 above 200-week EMA |
| India VIX | +0.51% | — | +12.09% | 2.35-point range |
Gap down, then buying from the lows. Every equity index opened lower and made its low after the open; Bank Nifty, Fin Service and the Midcap Select closed above their opens, and the Nifty closed level with its open. Closes in the range rose from 22–35% on Wednesday to 34–78%.
The order reversed. The financials and midcaps, which broke their channels and weekly marks on Wednesday, had the strongest closes on Thursday. The Sensex, which held its 200-week EMA on Wednesday, went through it and had the weakest close.
The week so far. All five equity indices are down between 1.64% and 2.93% with one session left; VIX is up 12.09%.
Commodities (Thursday evening, in progress). Silver is down nearly 4% and below the mark that held for a week; gold is lower in its falling channel; crude is back above 9,196.
What the institutional flow did
| FII net | DII net | Net | DII cover | |
|---|---|---|---|---|
| 19 Oct | −₹1,148.64 Cr | +₹3,201.19 Cr | +₹2,052.55 Cr | 2.79× |
| 21 Oct | +₹1,022.32 Cr | +₹1,614.32 Cr | +₹2,636.64 Cr | — |
| 22 Oct | −₹3,458.70 Cr | +₹2,891.32 Cr | −₹567.38 Cr | 0.84× |
FII selling returned. FIIs sold ₹3,458.70 Cr net — buying ₹13,627.54 Cr and selling ₹17,086.24 Cr — the largest FII sale since 15 October (−₹5,285.37 Cr). DIIs bought ₹2,891.32 Cr, covering 84% of it, so the net was negative for the first time this week. (Source: NSE's provisional figures for 22 October.)
F&O positioning
NSE's participant files for both days are out:
| Index fut | Index opt | Stock fut | Stock opt | FII net | |
|---|---|---|---|---|---|
| 19 Oct | −279,930 | −826,158 | +737,481 | −352,914 | −721,521 |
| 21 Oct | −277,628 | −938,747 | +781,550 | −383,336 | −818,161 |
| 22 Oct | −280,300 | −792,509 | +801,513 | −340,970 | −612,266 |
Shorter on Wednesday, longer on Thursday. FIIs added 96,640 net short contracts on Wednesday, mostly in index options. On Thursday they cut 205,895, again mostly in index options (+146,238), with stock options +42,366 and stock futures +19,963. Thursday's −612,266 is the third-least short reading of the 32 sessions in the record, after 15 and 16 October. Clients were net long 5,777,747 contracts on Thursday (6,033,711 on Wednesday).
The standing limits apply: these are net figures across all participants in a category, a few sessions are not a rule, and positions published after the close cannot have caused the candles that produced them.
Descriptive commentary on price structure and marked levels. It is not advice, not a recommendation, and contains no targets or entry levels. NEOGreeks is not a SEBI-registered investment adviser.