NIFTY 50 — 19 October 2026
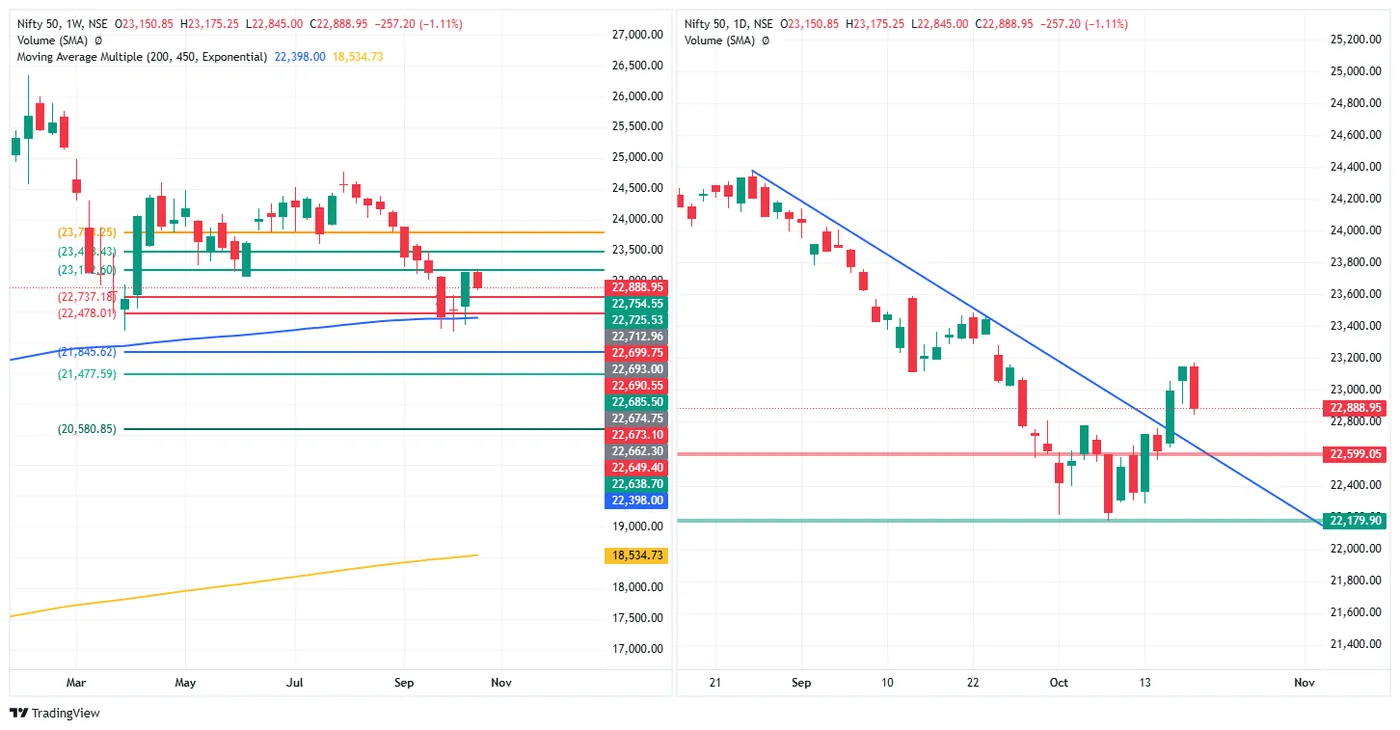
Close 22,888.95, down 257.20 (−1.11%), open 23,150.85, high 23,175.25, low 22,845.00. Tuesday 20 October is the Dussehra holiday — NSE and BSE are closed, so Monday's candle is the week so far.
Opened at Friday's level, closed near the low. The open was 4.70 above Friday's close of 23,146.15 and the high only 24.40 above the open. The close is at 13.3% of a 330.25-point range, 43.95 above the day's low.
Half of Thursday and Friday given back. Thursday and Friday added 523.45; Monday removed 257.20 of it (49%).
Marks. On the weekly chart Monday's high reached roughly 23,172 (label partly hidden) and the close is 151.77 above 22,737.18. The falling trendline that price crossed on Thursday is now below, near the 22,599.05 daily mark (289.90 under the close); the October support at 22,179.90 is 709.05 below.
The 200-week average. 490.95 above the 200-week EMA (22,398.00), 2.19%, down from 3.36% on Friday.
SENSEX — 19 October 2026
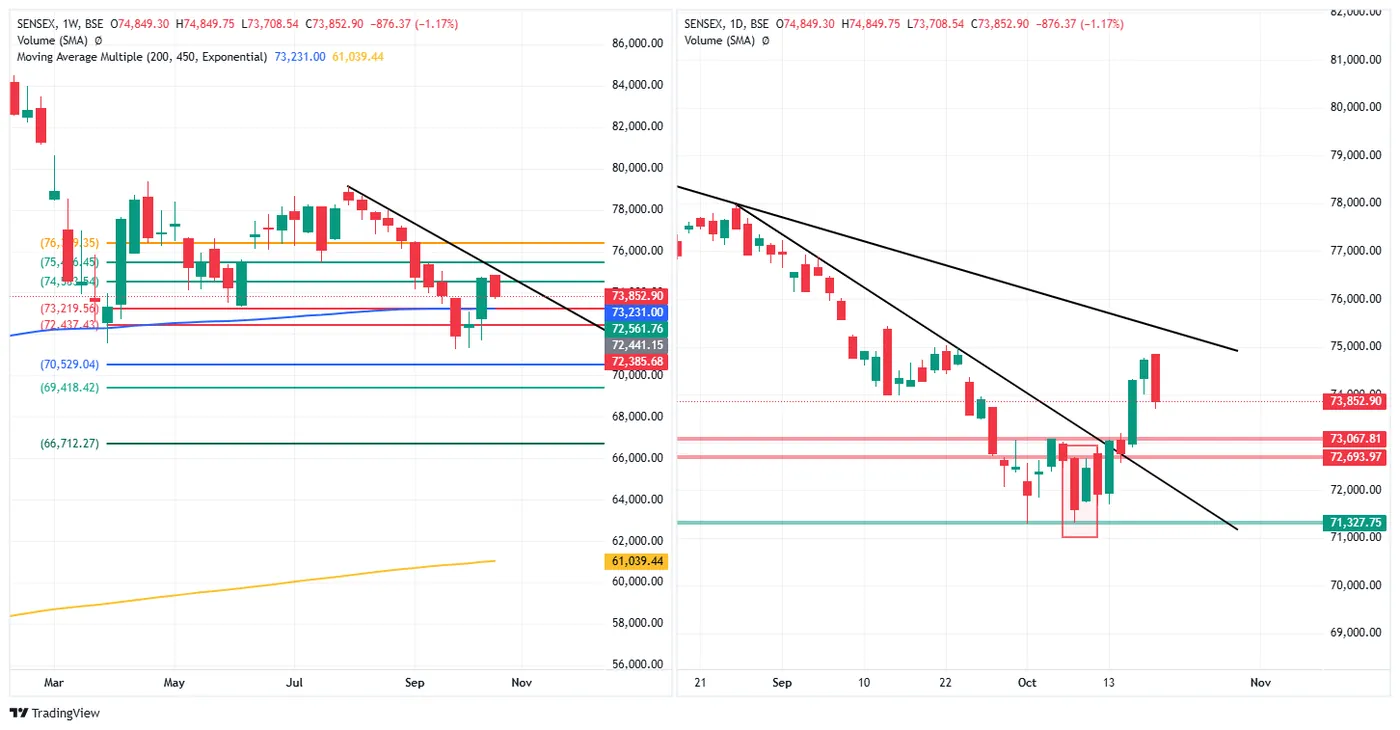
Close 73,852.90, down 876.37 (−1.17%), open 74,849.30, high 74,849.75, low 73,708.54.
Opened at the high. The high was 0.45 above the open, so the session traded lower from the first tick and closed at 12.6% of a 1,141.21-point range. Monday gave back 45% of Thursday and Friday's 1,947.38.
Structure. The steeper falling line from late August, crossed on 13–15 October, is below price. The flatter trendline from the August peak, near 75,300 at this point, is above (both read off the chart); Monday's open was under it. On the weekly chart, last week's high reached the falling line from the July high and Monday's candle is below it.
The 200-week average. 621.90 above (73,231.00), 0.85%, from 2.05% on Friday. Daily marks below: 73,067.81 (785.09 under the close), 72,693.97, 71,327.75.
BANK NIFTY — 19 October 2026
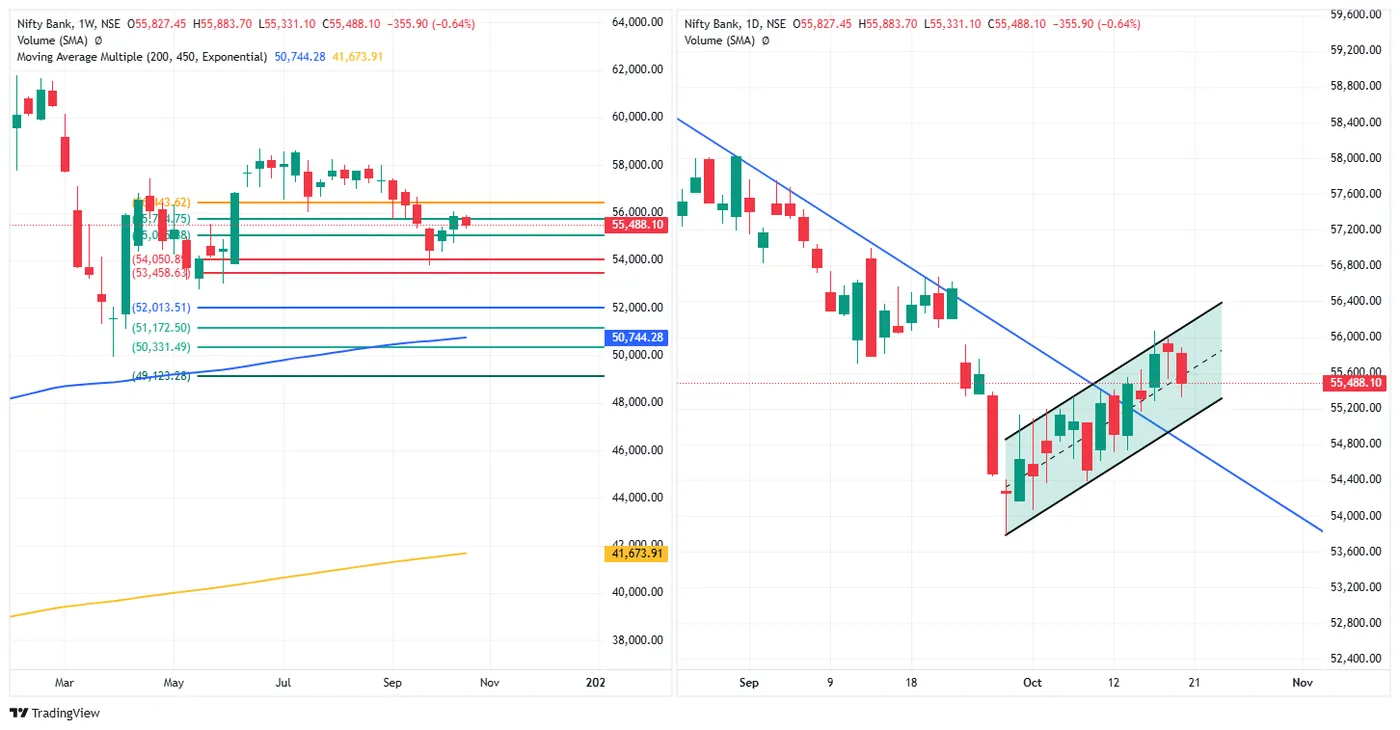
Close 55,488.10, down 355.90 (−0.64%), open 55,827.45, high 55,883.70, low 55,331.10 — the smallest fall of the equity indices.
Back to the middle of the channel. Thursday's high touched the top of the rising channel from the late-September low; Monday closed back near the dashed midline (read off the chart), at 28.4% of the day's range — the highest close position of the equity indices on Monday.
Weekly marks. The close sits between roughly 55,745 above (label partly hidden, about 257 overhead) and roughly 55,040 below. Further: 56,443.62 above; 54,050.89 and 53,458.63 below. 200-week EMA 50,744.28.
NIFTY FIN SERVICE — 19 October 2026
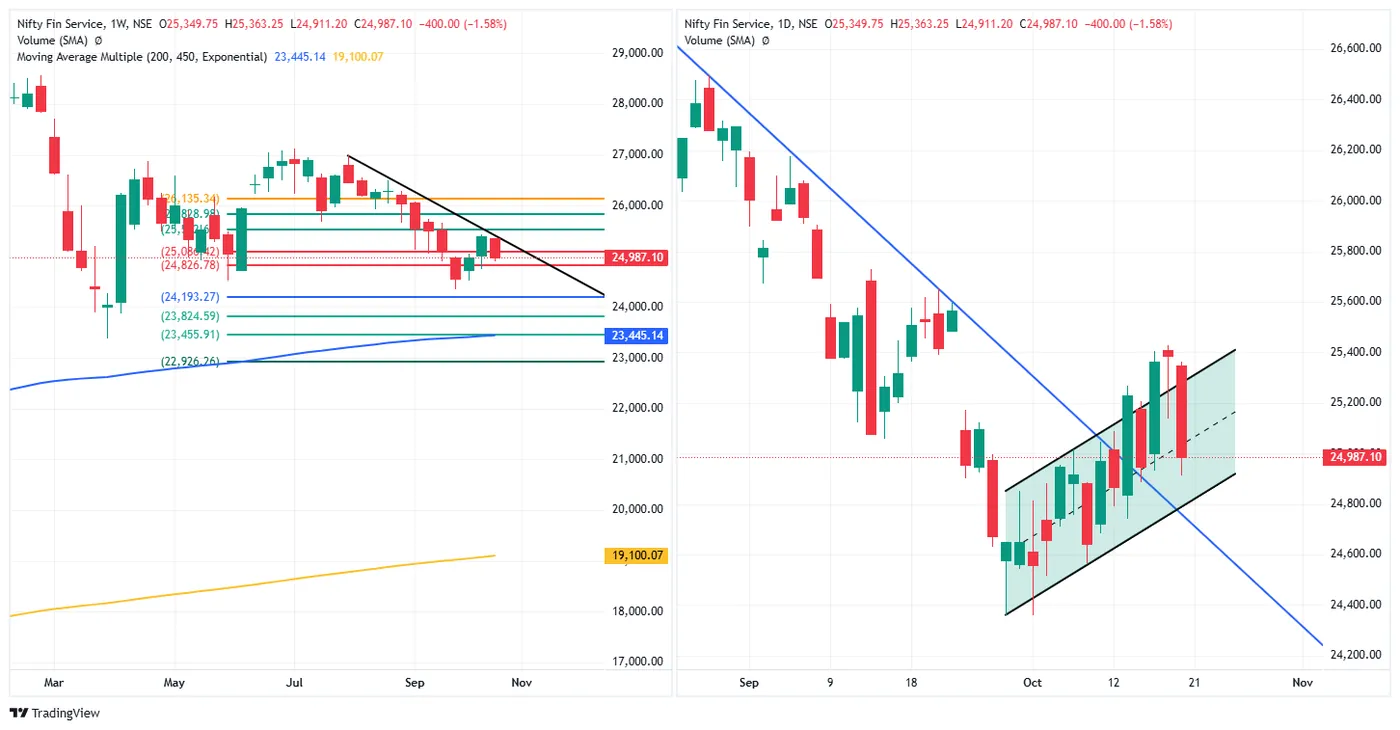
Close 24,987.10, down 400.00 (−1.58%), open 25,349.75, high 25,363.25, low 24,911.20 — the largest fall of the equity indices.
Back inside the channel. Friday closed above the upper line of the rising channel. Monday fell back inside it and closed near its midline (read off the chart), at 16.8% of the day's range. The 400.00-point fall is 91% of Thursday and Friday's 438.40-point gain.
Weekly marks. The close is between 25,086.42 (99.32 above) and 24,826.78 (160.32 below). On the weekly chart, last week's high reached the falling line from the July high. 200-week EMA 23,445.14.
NIFTY MIDCAP SELECT — 19 October 2026
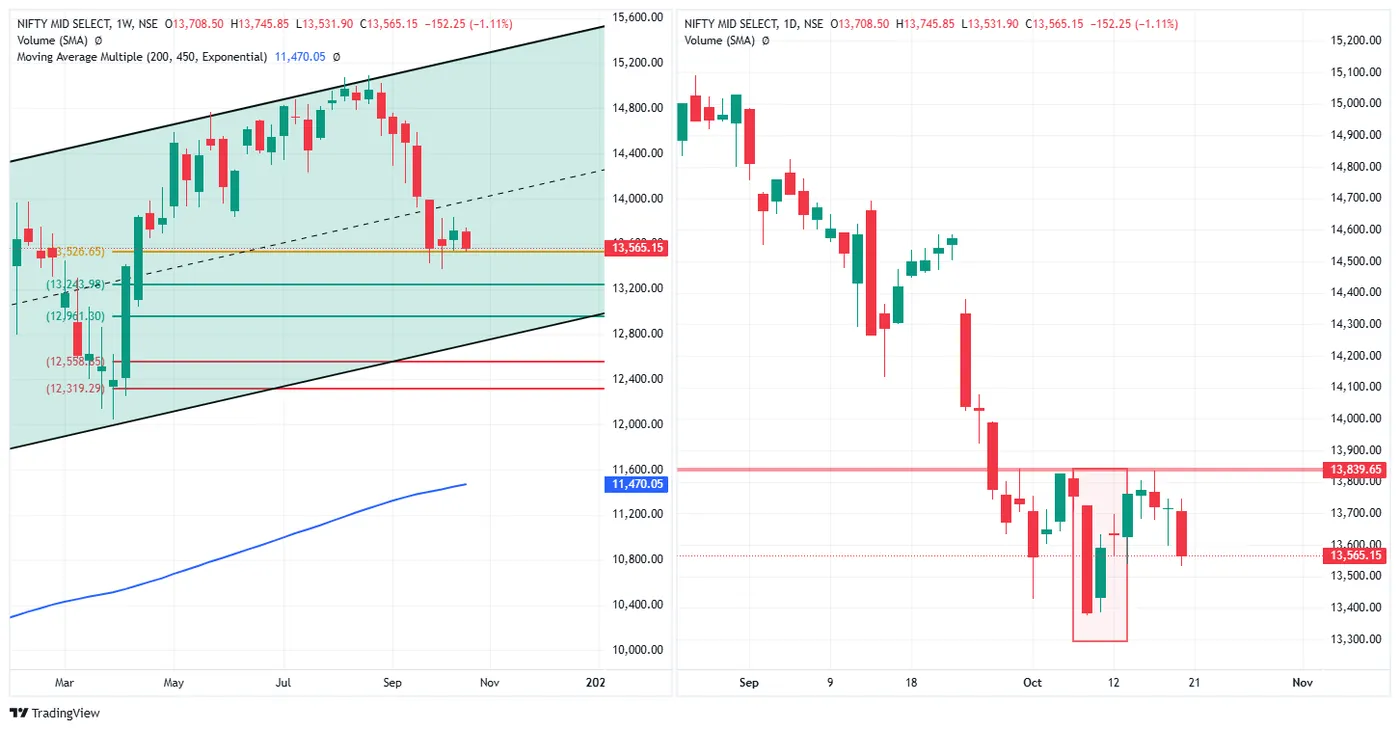
Close 13,565.15, down 152.25 (−1.11%), open 13,708.50, high 13,745.85, low 13,531.90.
On the weekly mark. The low stopped 5.25 above the weekly mark at 13,526.65 and the close is 38.50 above it, at 15.5% of the day's range. The daily mark at 13,839.65, which turned the index back three times in October, is 274.50 above.
Weekly channel. Price is in the lower half of the rising channel from 2025. Below the 13,526.65 mark: 13,243.98, 12,961.30, and the channel's lower line near 13,000 (read off the chart).
CRUDE OIL (MCX, 19 Nov fut) — 20 October 2026, evening session
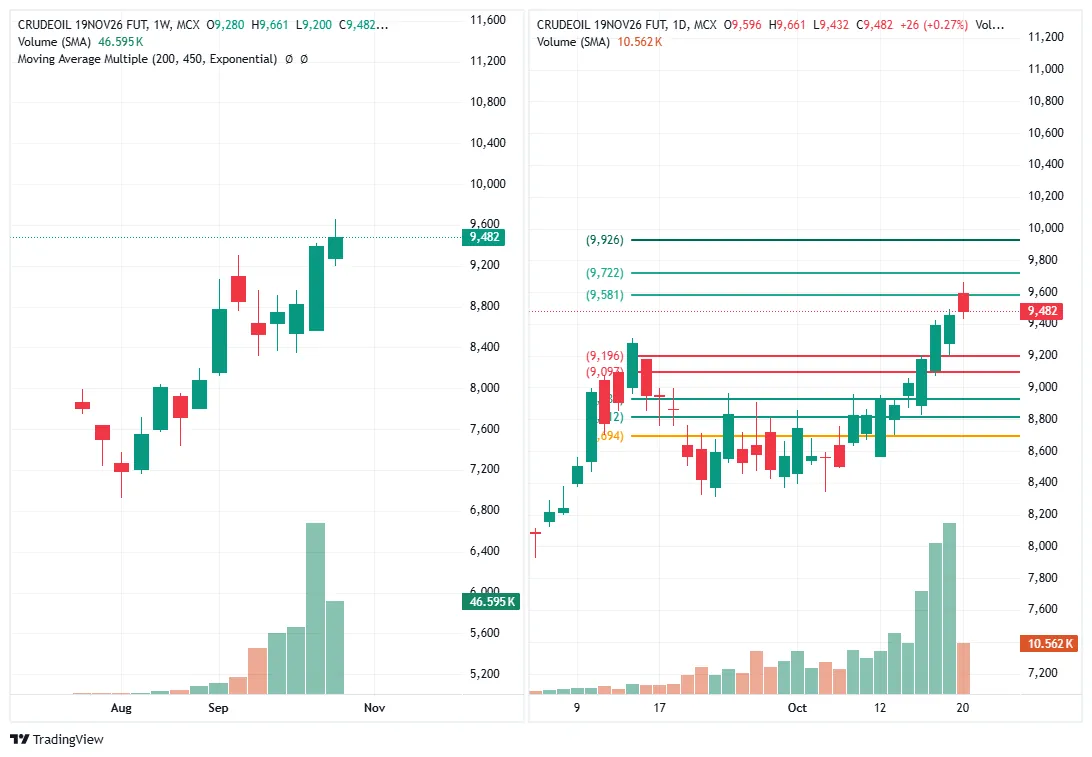
The October contract expired on 19 October; this chart is the November contract. MCX is trading on Tuesday evening (the equity holiday closed only the morning session), so these figures are from the session in progress.
At the time of the chart: 9,482, up 26 (+0.27%) from Monday's close of 9,456; open 9,596, high 9,661, low 9,432. Week so far: high 9,661, low 9,200.
Above, then back under 9,581. Tuesday's high of 9,661 went 80 above the mark at 9,581 and price is now 99 below it. Further marks above: 9,722 and 9,926. Below: 9,196 and 9,097, then the September range marks near 8,900, 8,812 and 8,694. Monday's volume was the highest on the November contract's chart, as positions rolled in from October.
GOLD (MCX, 4 Dec fut) — 20 October 2026, evening session
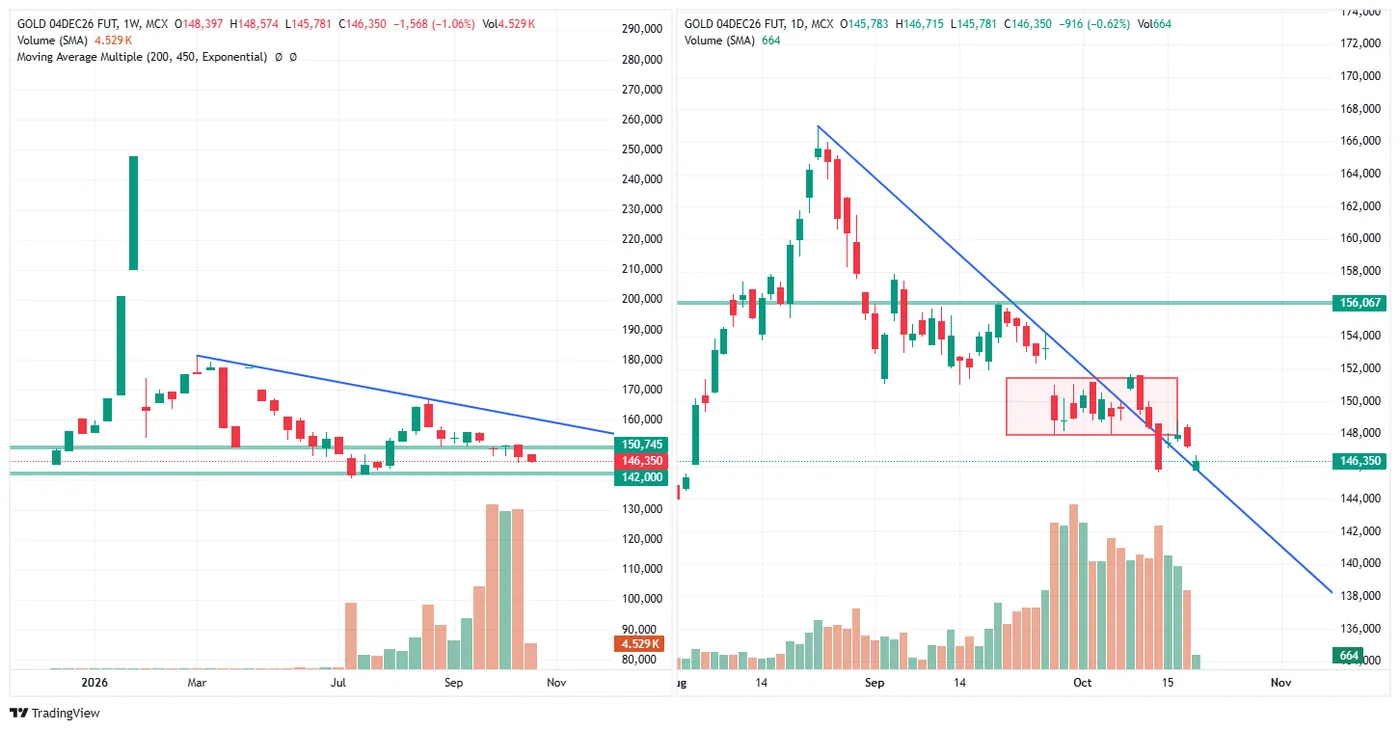
At the time of the chart (session in progress, volume 664): 146,350, down 916 (−0.62%) from Monday's close of 147,266; open 145,783, high 146,715, low 145,781. Monday itself was down 734 from Friday's 148,000.
On the falling trendline. The descending trendline from the late-August peak runs through today's candle (read off the chart). Price is back below the two-week box (roughly 147,900–151,500) that it reached the bottom of on Friday.
Weekly. A new horizontal mark at 142,000 is 4,350 below — the area of the July lows. 150,745 is 4,395 above.
SILVER (MCX, 4 Dec fut) — 20 October 2026, evening session
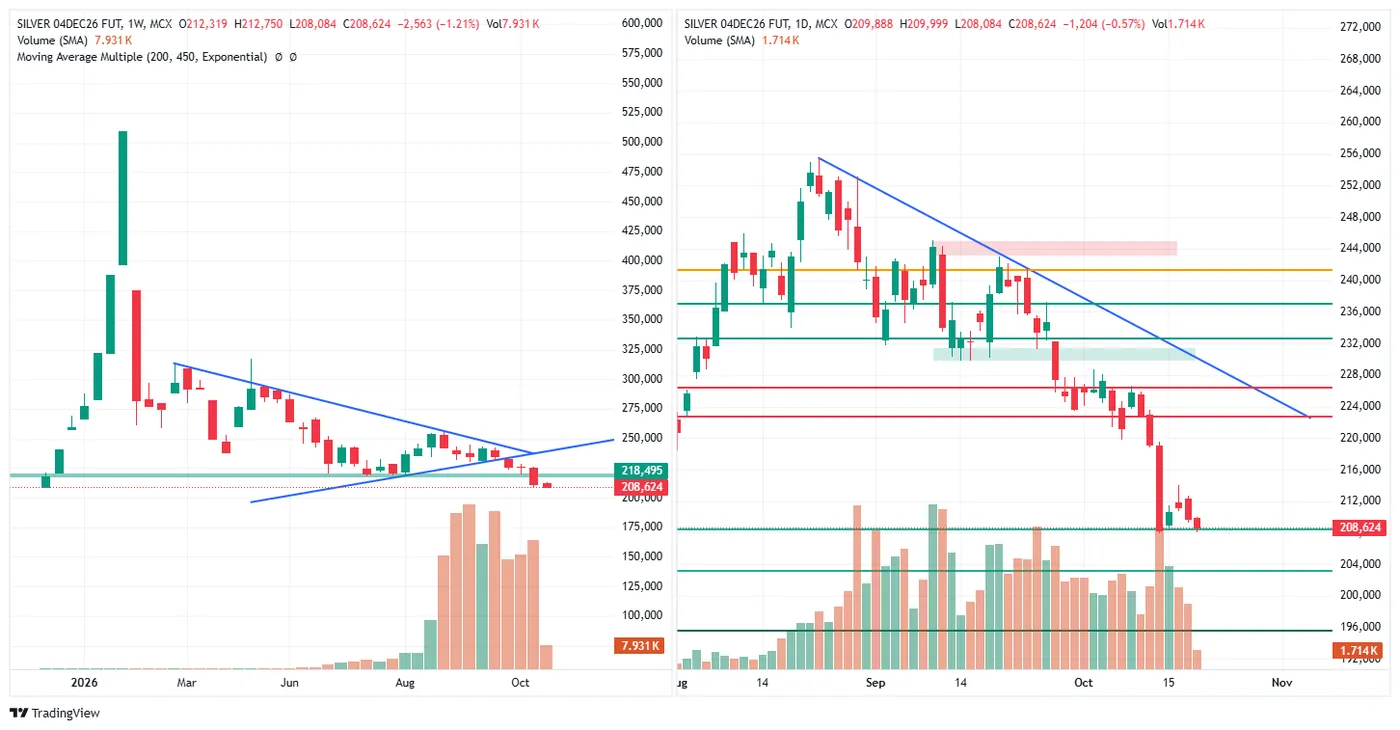
At the time of the chart (volume 1.714K): 208,624, down 1,204 (−0.57%) from Monday's close of 209,828; open 209,888, high 209,999, low 208,084. Monday was down 1,590 (−0.75%) from Friday's 211,418.
At the mark again. Price is back at the daily mark near 208,441 (183 above it), which held the closes on 14–16 October. Below: 203,191 and 195,651. The weekly mark at 218,495 is 9,871 above.
Read across the session
| Monday | Closed in its range | From Friday | |
|---|---|---|---|
| Bank Nifty | −0.64% | 28.4% | smallest fall |
| Nifty 50 | −1.11% | 13.3% | gave back 49% of Thu–Fri |
| Nifty Midcap Select | −1.11% | 15.5% | low 5.25 above weekly mark |
| Sensex | −1.17% | 12.6% | gave back 45% of Thu–Fri |
| Nifty Fin Service | −1.58% | 16.8% | gave back 91% of Thu–Fri |
One-directional session. Every equity index opened near Friday's close, made its high early and closed in the bottom third of the day. The Sensex's high was 0.45 above its open.
The lines that were crossed last week are now below. The Nifty's falling trendline and its 200-week EMA, the Sensex's 200-week EMA and the steeper Sensex trendline are all under Monday's close; none was retested on Monday.
Financials led down. Fin Service, last week's strongest finisher outside the large caps, had the largest fall; Bank Nifty the smallest.
Commodities (Tuesday evening, in progress). Crude holds near its highs on the new November contract; gold and silver are lower again and sitting on marked levels.
What the institutional flow did
| FII net | DII net | Net | DII cover | |
|---|---|---|---|---|
| 15 Oct | −₹5,285.37 Cr | +₹3,319.39 Cr | −₹1,965.98 Cr | 0.63× |
| 16 Oct | +₹1,165.92 Cr | −₹3,661.28 Cr | −₹2,495.36 Cr | — |
| 19 Oct | −₹1,148.64 Cr | +₹3,201.19 Cr | +₹2,052.55 Cr | 2.79× |
Back to the usual pattern after one day. Friday's FII buying did not carry into Monday: FIIs sold ₹1,148.64 Cr and DIIs bought ₹3,201.19 Cr, covering it 2.79 times — the highest cover since 21 September. The net was positive on a day every equity index fell more than 0.6%.
F&O positioning
NSE's participant file for 19 October was not yet in the record when this was written, so the latest reading is Friday's (16 October): FII net −573,117 contracts — index futures −272,999, index options −794,912, stock futures +776,664, stock options −281,870. That is the second-least short reading in the record; Thursday 15 October (−417,135) was the least. Clients were net long 5,099,559 contracts.
The standing limits apply: these are net figures across all participants in a category, a few sessions are not a rule, and positions published after the close cannot have caused the candles that produced them.
Descriptive commentary on price structure and marked levels. It is not advice, not a recommendation, and contains no targets or entry levels. NEOGreeks is not a SEBI-registered investment adviser.