NIFTY 50 — 16 October 2026
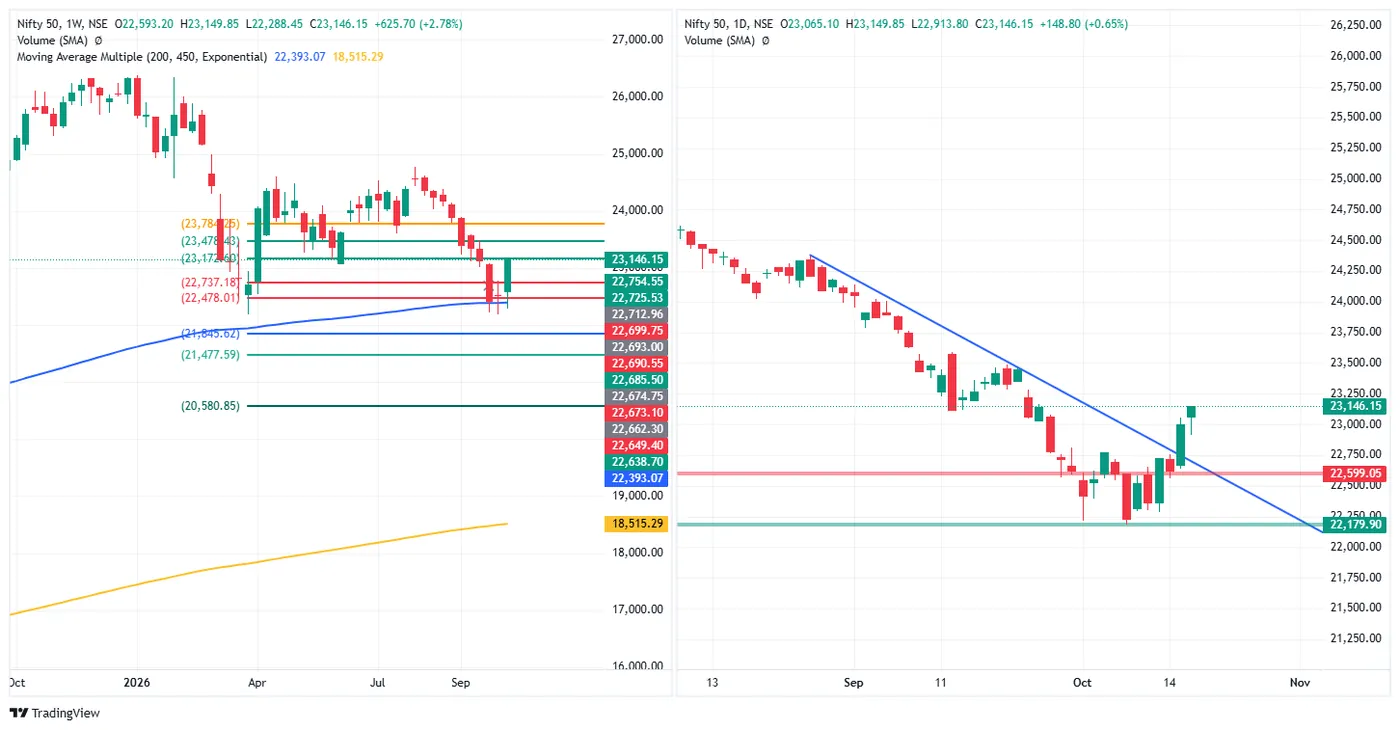
Close 23,146.15, up 148.80 (+0.65%), open 23,065.10, high 23,149.85, low 22,913.80. Thursday closed 22,997.35, up 374.65 (+1.66%), from an open of 22,671.30 and a low of 22,637.40.
The week: +2.78% (+625.70), open 22,593.20, high 23,149.85, low 22,288.45, closing 99.6% of the way up an 861.40-point range — 3.70 below the week's high. Friday closed at 98.4% of its own range.
Through the falling trendline. On Wednesday the high reached the descending trendline from late August (near 22,700–22,760) and the close came back below it. Thursday opened under it, crossed it, and closed 374.65 higher; Friday held above (trendline position read off the chart).
Marks. The daily mark at 22,599.05 is now 547.10 below the close and the October support at 22,179.90 is 966.25 below. On the weekly chart the close is 408.97 above 22,737.18 and just under the next mark, roughly 23,172 (label partly hidden). Further up: 23,478.43 and roughly 23,784.
The 200-week average. 753.08 above the 200-week EMA (22,393.07), 3.36% — the third weekly close above it, and the widest of the three. The week's low of 22,288.45 was 104.62 under it.
SENSEX — 16 October 2026
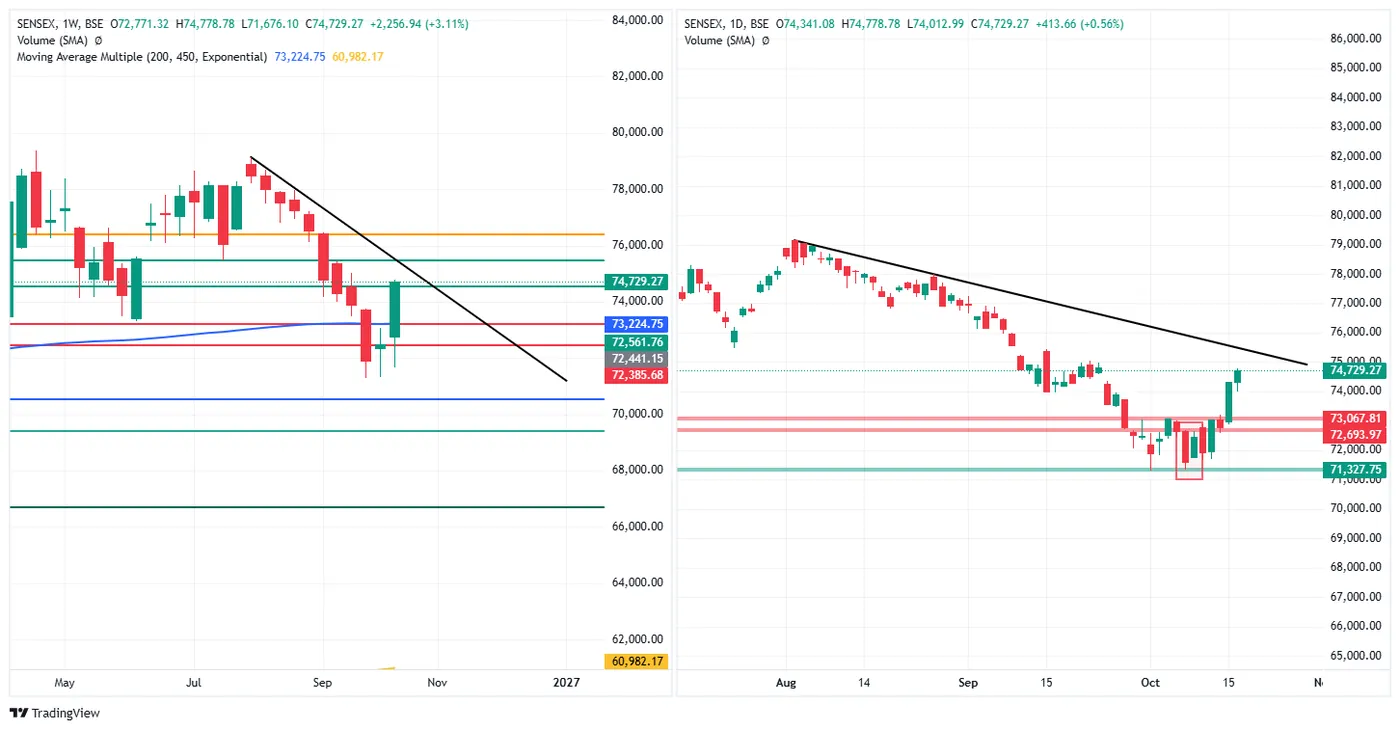
Close 74,729.27, up 413.66 (+0.56%), open 74,341.08, high 74,778.78, low 74,012.99. Thursday closed 74,315.61, up 1,533.72 (+2.11%).
The week: +3.11% (+2,256.94), high 74,778.78, low 71,676.10, closing 98.4% up a 3,102.68-point range. Friday closed at 93.5% of its range.
Back above the 200-week average. On Wednesday the high stopped 10.11 short of the 200-week EMA. Thursday closed above it, and Friday's close is 1,504.52 above (73,224.75), 2.05%. The Nifty and the Sensex are now on the same side of their 200-week lines for the first time in these notes.
Overhead. The falling trendline from the August peak (daily chart) runs near 75,300 at this point, and the weekly chart's falling line from the July high is close to this week's high (both read off the chart). Below, the daily marks at 73,067.81 (1,661.46 under the close) and 72,693.97, then 71,327.75.
BANK NIFTY — 16 October 2026
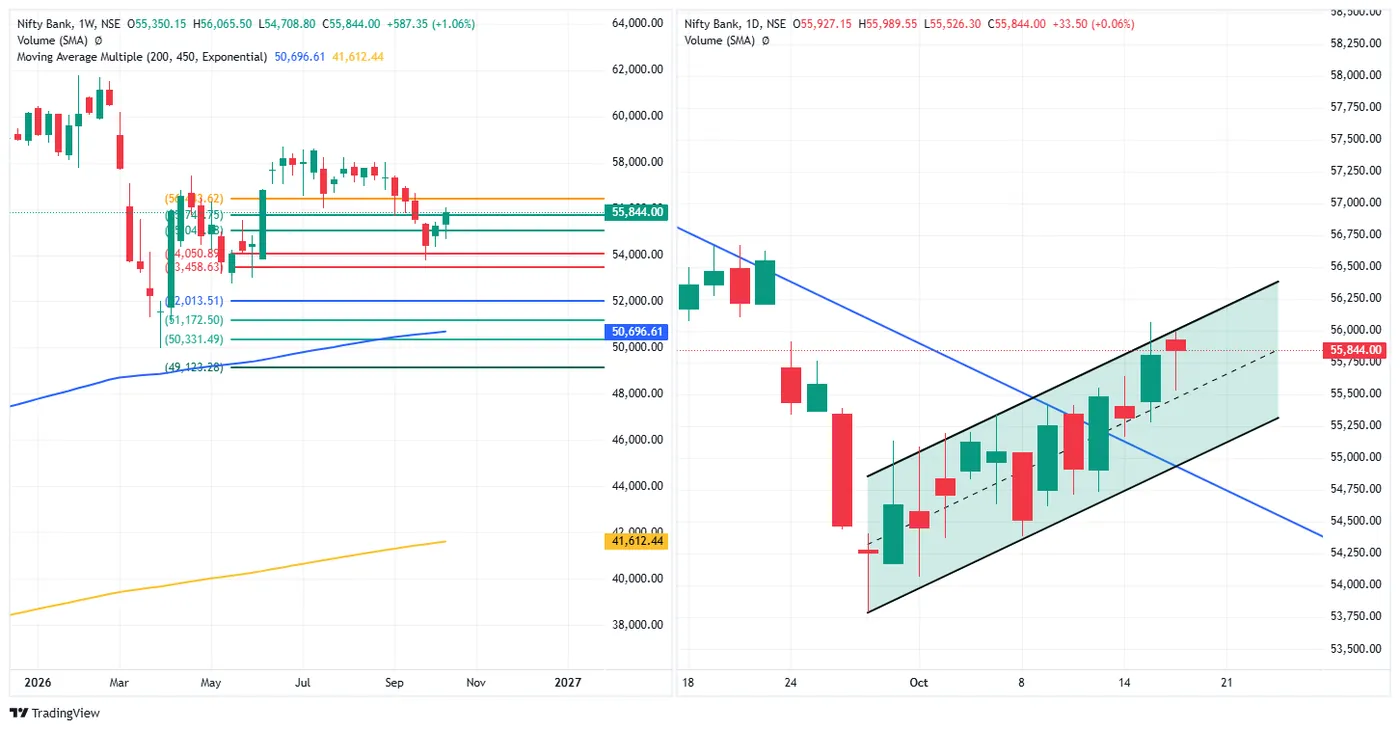
Close 55,844.00, up 33.50 (+0.06%), open 55,927.15, high 55,989.55, low 55,526.30. Thursday closed 55,810.50, up 494.50 (+0.89%).
The week: +1.06% (+587.35), high 56,065.50, low 54,708.80, closing 83.7% up the range. Friday closed at 68.6% of its range.
At the top of the channel. Thursday's high of 56,065.50 reached the upper line of the rising channel from the late-September low. Friday opened below that and stayed below it all session (channel read off the chart). The descending trendline from August, which Bank Nifty crossed on 13 October, is now well below price.
Weekly marks. The close is just above the mark near 55,745 (label partly hidden). Above it, 56,443.62 is 599.62 overhead. Below: roughly 55,040, 54,050.89, 53,458.63. 200-week EMA 50,696.61.
NIFTY FIN SERVICE — 16 October 2026
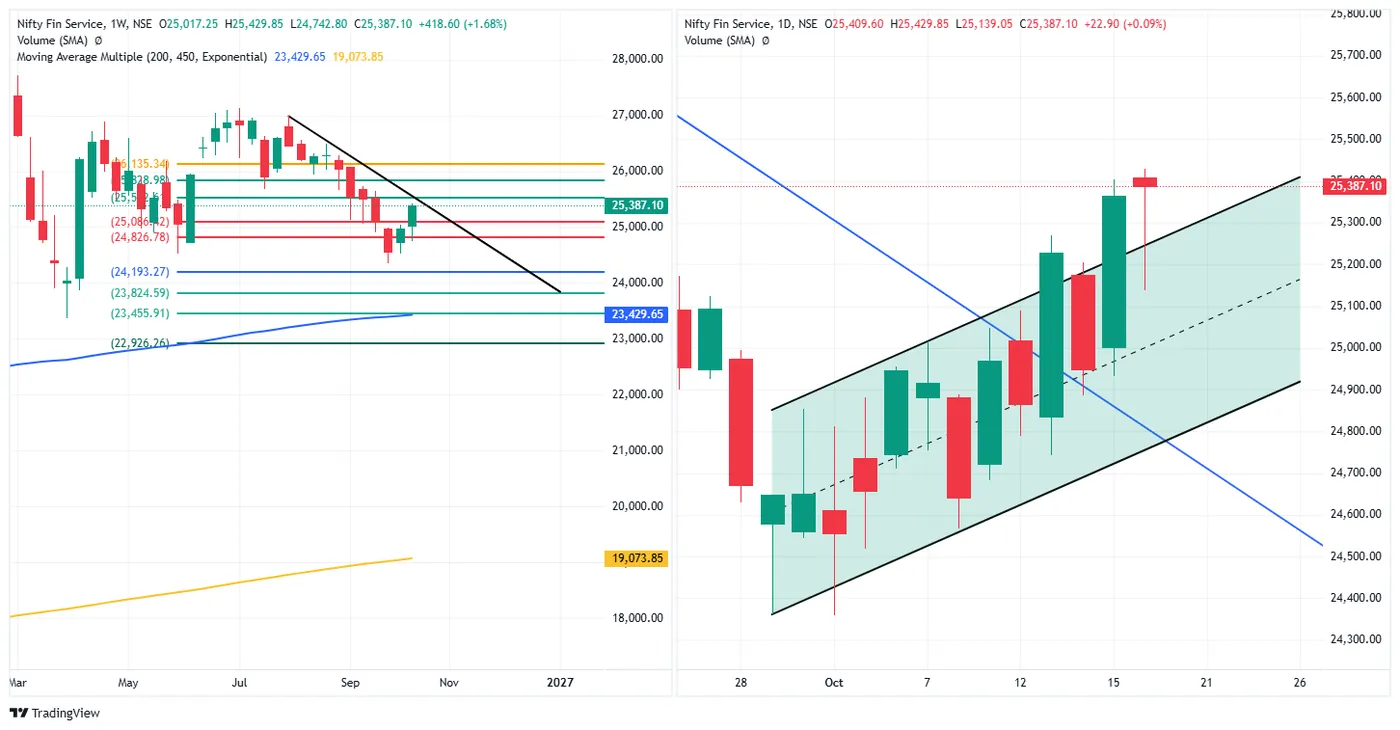
Close 25,387.10, up 22.90 (+0.09%), open 25,409.60, high 25,429.85, low 25,139.05. Thursday closed 25,364.20, up 415.50 (+1.67%).
The week: +1.68% (+418.60), high 25,429.85, low 24,742.80, closing 93.8% up the range. On Wednesday it was the only equity index lower on the week; it finished level with the Nifty's weekly gain in percentage terms.
Above the channel. Thursday closed above the upper line of the rising channel. Friday dipped back inside it (low 25,139.05) and closed above it again at 85.3% of the day's range (read off the chart). On the weekly chart the falling line from the July high is just above this week's high.
Weekly marks. 25,086.42 is now 300.68 below the close. Above: roughly 25,520, then 25,828.98 and 26,135.34. 200-week EMA 23,429.65.
NIFTY MIDCAP SELECT — 16 October 2026
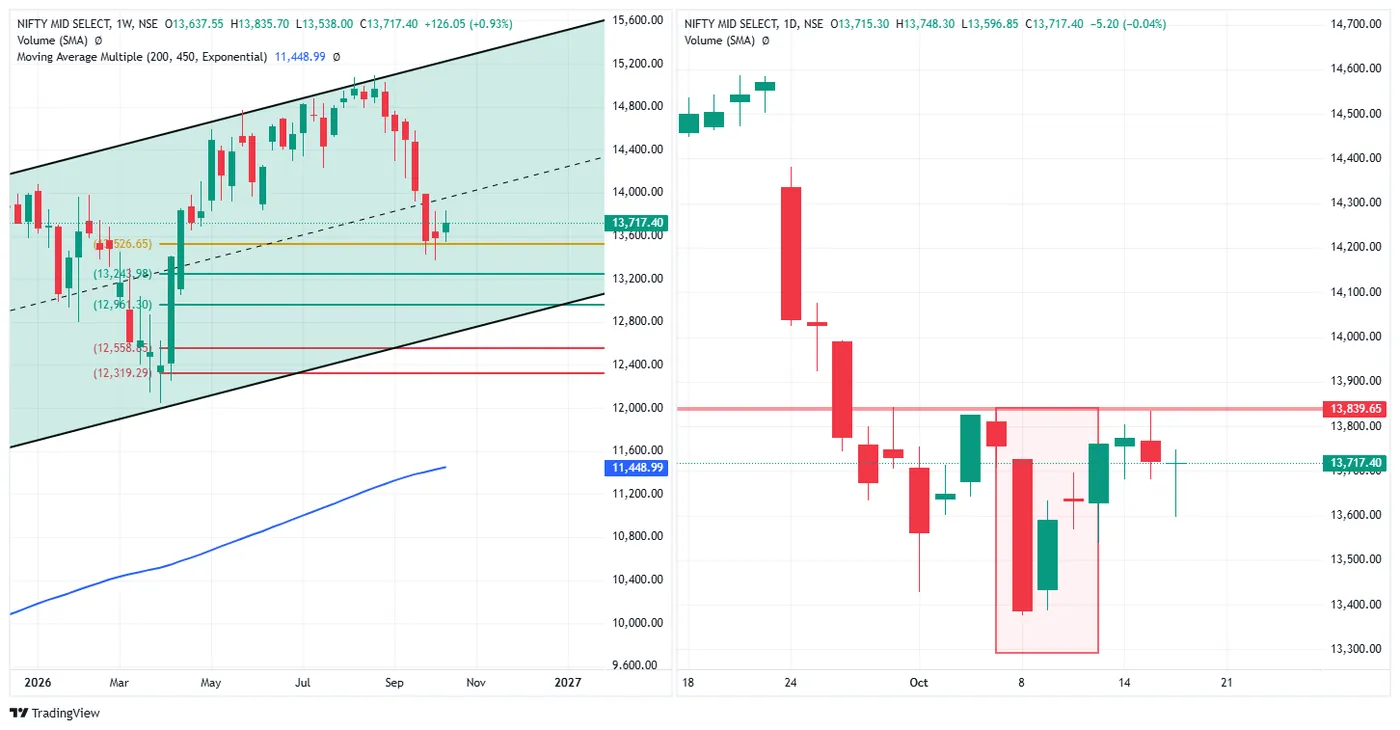
Close 13,717.40, down 5.20 (−0.04%), open 13,715.30, high 13,748.30, low 13,596.85. Thursday closed 13,722.60, down 50.55 (−0.37%).
The week: +0.93% (+126.05), high 13,835.70, low 13,538.00, closing 60.3% up the range — the smallest gain and lowest weekly close position of the equity indices. On Wednesday it led the week (+1.34%); it fell on both Thursday and Friday while the large caps rose.
Turned back at the October mark again. Thursday's high of 13,835.70 stopped 3.95 below 13,839.65, the daily mark that has capped the index since early October. The close is 122.25 under it. Friday's candle has a long lower shadow: the low was 120.55 below the close.
Weekly. The close is 190.75 above the weekly mark near 13,527, in the lower half of the weekly rising channel, below its dashed midline.
INDIA VIX — 16 October 2026
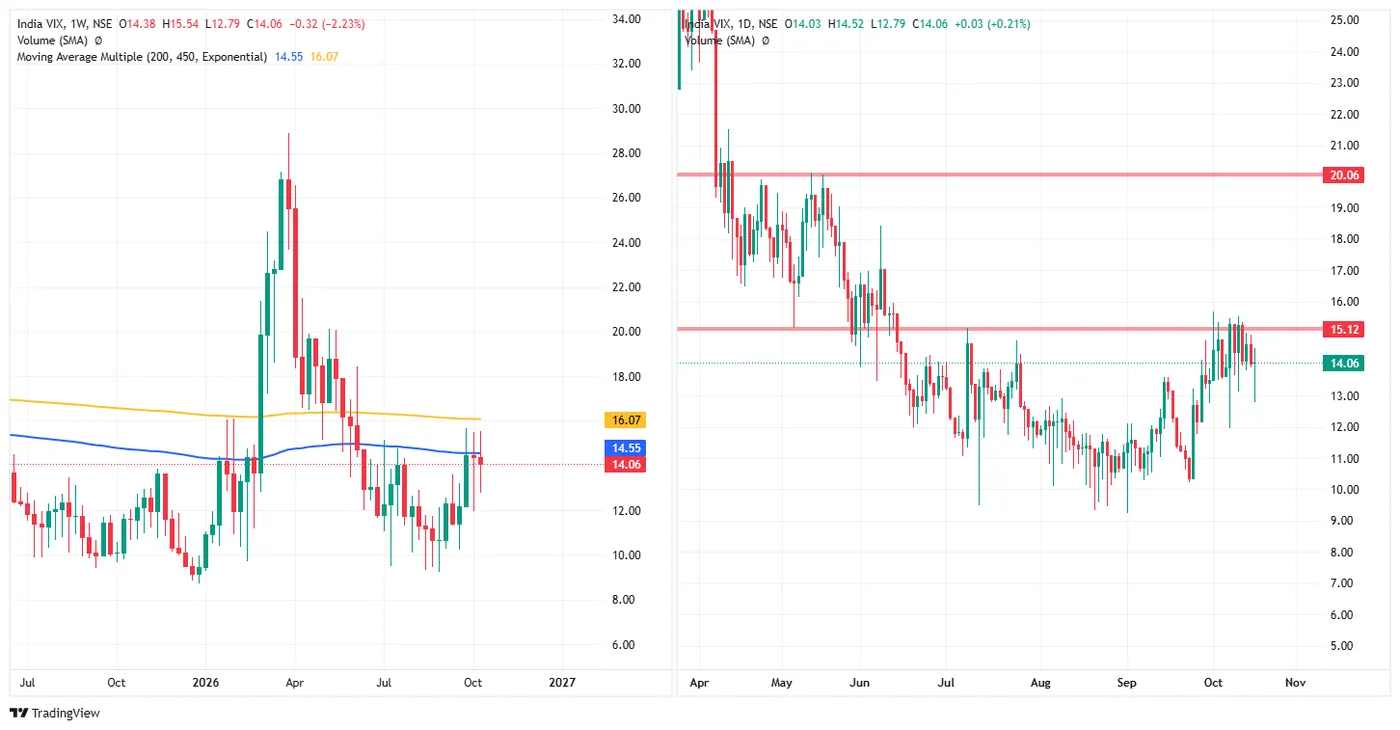
Close 14.06, up 0.03 (+0.21%), open 14.03, high 14.52, low 12.79.
The week: −2.23% (−0.32), high 15.54, low 12.79. The week's high went above the 15.12 band and the close is 1.06 below it. On the weekly chart VIX is 0.49 below its 200-week EMA (14.55).
Little change for a +2.8% week. The Nifty and Sensex gained 2.78% and 3.11% on the week, while VIX fell only 2.23% and finished Friday slightly higher. Friday's low of 12.79 was the lowest print of the week; the close came back 1.27 above it.
CRUDE OIL (MCX, 19 Oct fut) — 16 October 2026
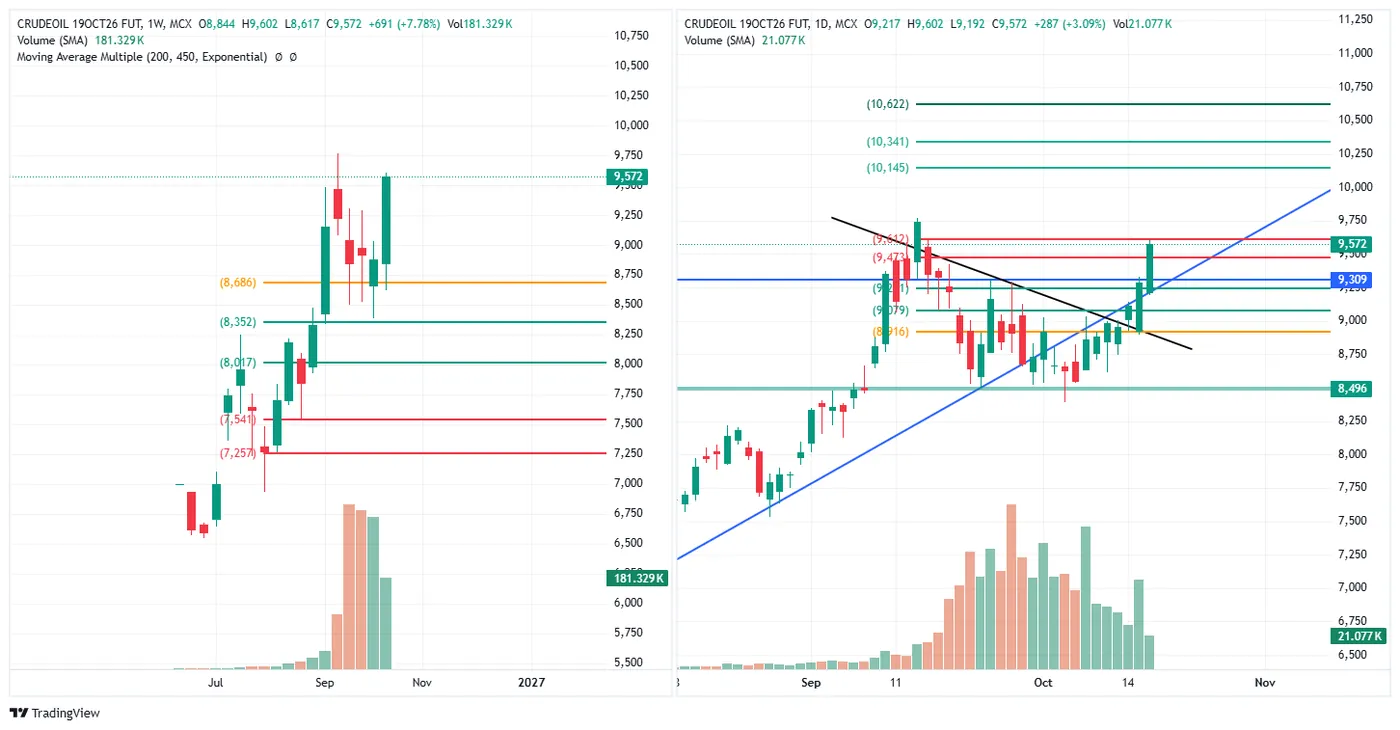
Close 9,572, up 287 (+3.09%), open 9,217, high 9,602, low 9,192. Volume 21.077K.
The week: +7.78% (+691), open 8,844, high 9,602, low 8,617, closing 97.0% up the range — the largest weekly move on this page. Weekly volume 181.329K.
Above 9,309. The horizontal mark at 9,309, which capped price through the second half of September, is now 263 below the close. Friday's high of 9,602 stopped 10 below the new mark at 9,612; further marks above at 10,145, 10,341 and 10,622. Below: 9,473 (99 under the close), then roughly 9,251, 9,079 and 8,916.
Contract. The October contract expires on Monday, 19 October. Friday's volume (21.077K) is low because positions have largely moved to November.
GOLD (MCX, 4 Dec fut) — 16 October 2026
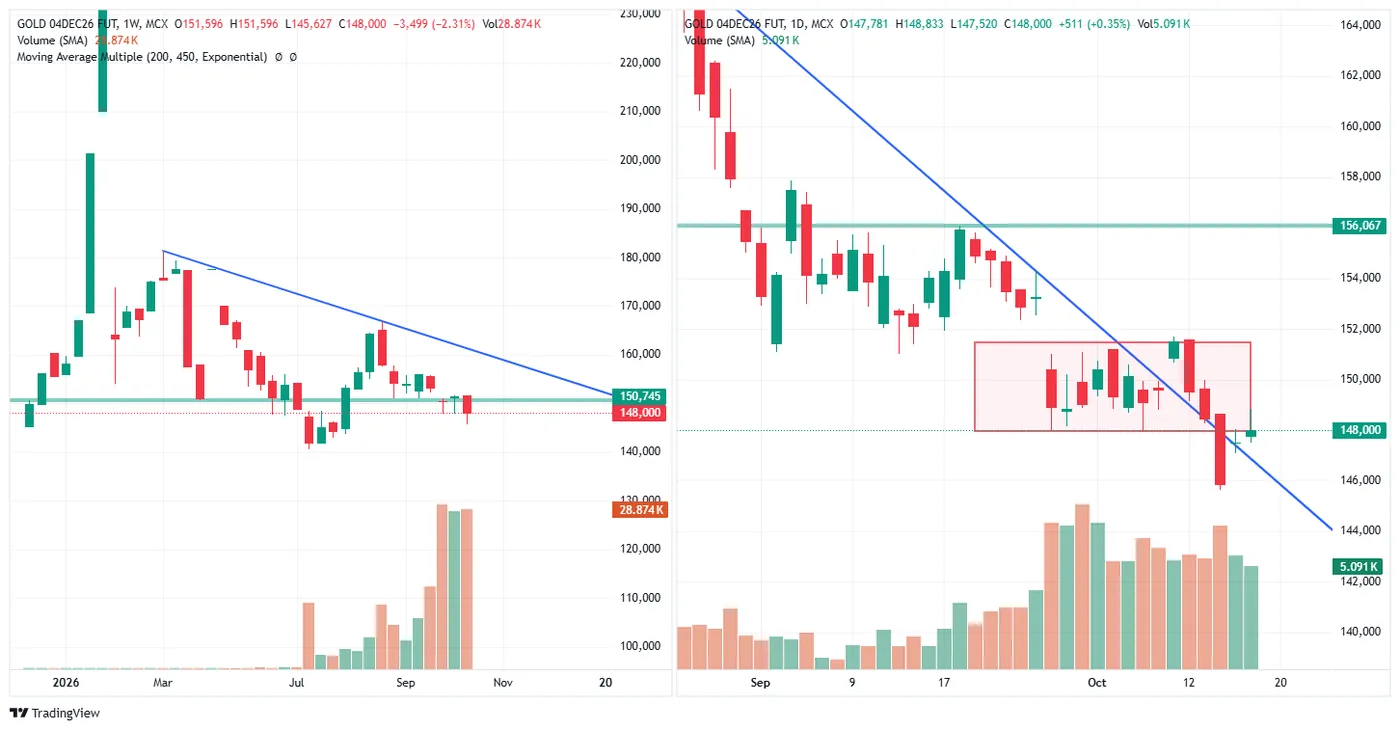
Close 148,000, up 511 (+0.35%), open 147,781, high 148,833, low 147,520. Volume 5.091K. Thursday closed 147,489, up 1,639 (+1.12%).
The week: −2.31% (−3,499), high 151,596, low 145,627, closing 39.8% up the range. The week's high is still the week's open.
Back to the edge of the box. Wednesday closed below the two-week box (roughly 147,900–151,500). Thursday and Friday recovered to its lower edge: Friday's close is at it. The weekly mark at 150,745 is 2,745 above; the daily mark at 156,067 is 8,067 above.
SILVER (MCX, 4 Dec fut) — 16 October 2026
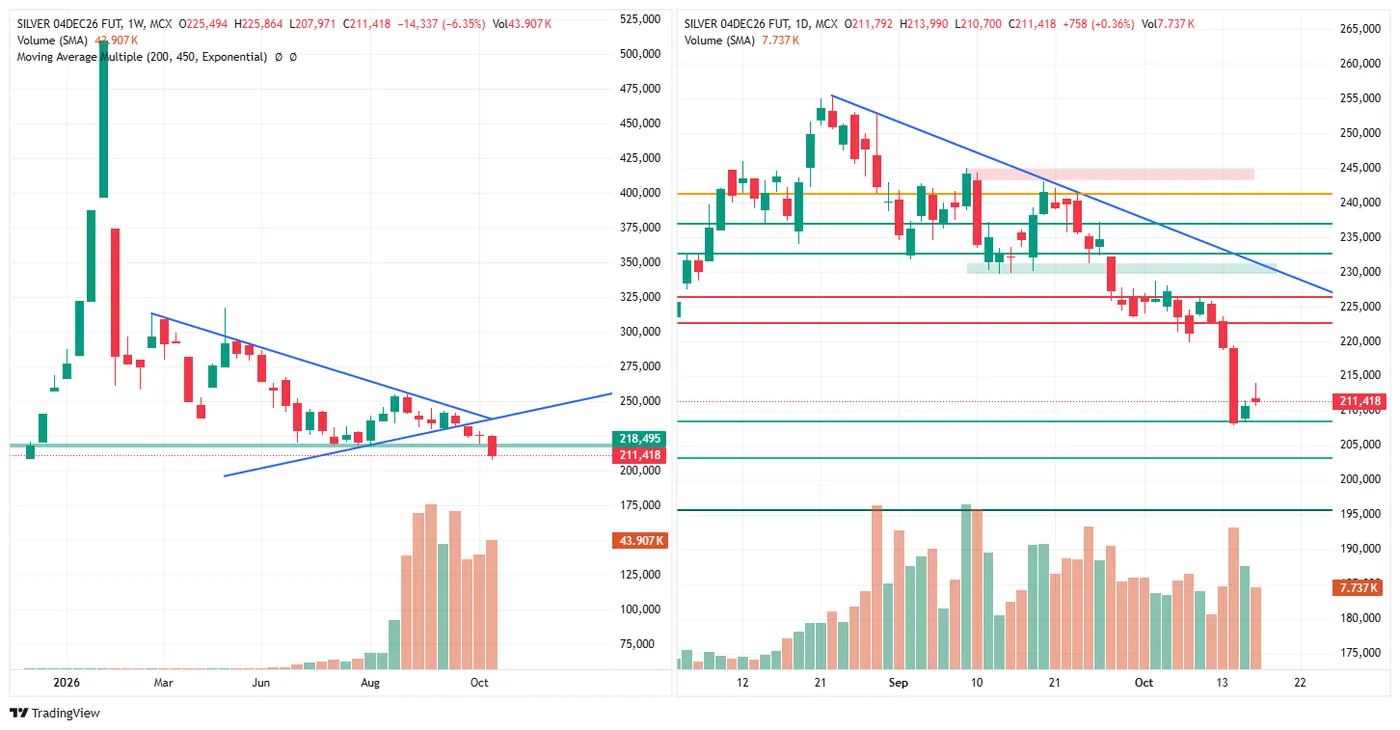
Close 211,418, up 758 (+0.36%), open 211,792, high 213,990, low 210,700. Volume 7.737K. Thursday closed 210,660, up 2,670 (+1.28%).
The week: −6.35% (−14,337), high 225,864, low 207,971, closing 19.3% up the range.
Holding the mark it reached on Wednesday. Wednesday closed at the daily mark near 208,441; Thursday and Friday stayed above it, and the close is 2,977 over it. The weekly mark at 218,495 is 7,077 above the close. Further marks below: 203,191 and 195,651. Friday closed at 21.8% of its range, below its open.
Read across the session
| Friday | Closed in its range | Week | Up its weekly range | |
|---|---|---|---|---|
| Crude oil (Oct) | +3.09% | 92.7% | +7.78% | 97.0% |
| Sensex | +0.56% | 93.5% | +3.11% | 98.4% |
| Nifty 50 | +0.65% | 98.4% | +2.78% | 99.6% |
| Nifty Fin Service | +0.09% | 85.3% | +1.68% | 93.8% |
| Bank Nifty | +0.06% | 68.6% | +1.06% | 83.7% |
| Nifty Midcap Select | −0.04% | 79.6% | +0.93% | 60.3% |
| India VIX | +0.21% | −2.23% | ||
| Gold (Dec) | +0.35% | 36.6% | −2.31% | 39.8% |
| Silver (Dec) | +0.36% | 21.8% | −6.35% | 19.3% |
Large caps closed the week at their highs. The Nifty closed 3.70 below its weekly high and the Sensex 49.51 below its own. Thursday did most of the work: +1.66% and +2.11%.
Both 200-week lines are below price. The Nifty is 3.36% above its 200-week EMA and the Sensex 2.05% above. A week ago only the Nifty was above.
Midcaps went the other way late in the week. Midcap Select led on Wednesday and then fell on Thursday and Friday, turned back 3.95 below the 13,839.65 mark.
Commodities split three ways. Crude gained 7.78% to its highest weekly close here; gold recovered to the edge of its box but still fell 2.31% on the week; silver held its Wednesday low and fell 6.35% on the week.
What the institutional flow did
| FII net | DII net | Net | DII cover | |
|---|---|---|---|---|
| 12 Oct | −₹1,708.48 Cr | +₹3,045.02 Cr | +₹1,336.54 Cr | 1.78× |
| 13 Oct | −₹1,305.13 Cr | +₹2,439.24 Cr | +₹1,134.11 Cr | 1.87× |
| 14 Oct | −₹1,857.44 Cr | +₹2,670.44 Cr | +₹813.00 Cr | 1.44× |
| 15 Oct | −₹5,285.37 Cr | +₹3,319.39 Cr | −₹1,965.98 Cr | 0.63× |
| 16 Oct | +₹1,165.92 Cr | −₹3,661.28 Cr | −₹2,495.36 Cr | — |
| Week | −₹8,990.50 Cr | +₹7,812.81 Cr | −₹1,177.69 Cr | 0.87× |
Friday reversed the usual pattern. FIIs were net buyers (+₹1,165.92 Cr) on 16 October — their first net-buying day since 23 September — and DIIs were net sellers (−₹3,661.28 Cr). Thursday, the day of the largest index gains, had the week's biggest FII sale (₹5,285.37 Cr), covered 0.63× by DII buying.
The week overall. FII selling of ₹8,990.50 Cr was under a third of the previous week's ₹30,294.29 Cr. DII buying covered 0.87× of it, so the week's net was −₹1,177.69 Cr.
F&O positioning
FII net position by segment, in contracts (calls long and puts short count as long; puts long and calls short as short):
| 9 Oct | 12 Oct | 13 Oct | 14 Oct | 15 Oct | 16 Oct | Week | |
|---|---|---|---|---|---|---|---|
| Index futures | −293,988 | −295,860 | −289,495 | −296,697 | −279,827 | −272,999 | +20,989 |
| Index options | −887,310 | −948,209 | −854,333 | −877,671 | −654,908 | −794,912 | +92,398 |
| Stock futures | +675,468 | +685,578 | +774,020 | +743,986 | +786,561 | +776,664 | +101,196 |
| Stock options | −279,854 | −306,374 | −276,777 | −299,053 | −268,961 | −281,870 | −2,016 |
| Net | −785,684 | −864,865 | −646,585 | −729,435 | −417,135 | −573,117 | +212,567 |
The FII book ended the week 212,567 contracts less short. Stock-futures longs rose by 101,196 and reached 786,561 on 15 October, the largest in the record. Index options were 92,398 less short; the biggest single-day change was Thursday (+222,763), the day of the large index gains, and Friday gave back 140,004 of it. Index futures were 20,989 less short at −272,999.
Clients sit on the other side, as usual: net long 5,099,559 contracts on Friday.
The standing limits apply: these are net figures across all participants in a category, one week is not a rule, and positions published after the close cannot have caused the candles that produced them.
Descriptive commentary on price structure and marked levels. It is not advice, not a recommendation, and contains no targets or entry levels. NEOGreeks is not a SEBI-registered investment adviser.