NIFTY 50 — 14 October 2026
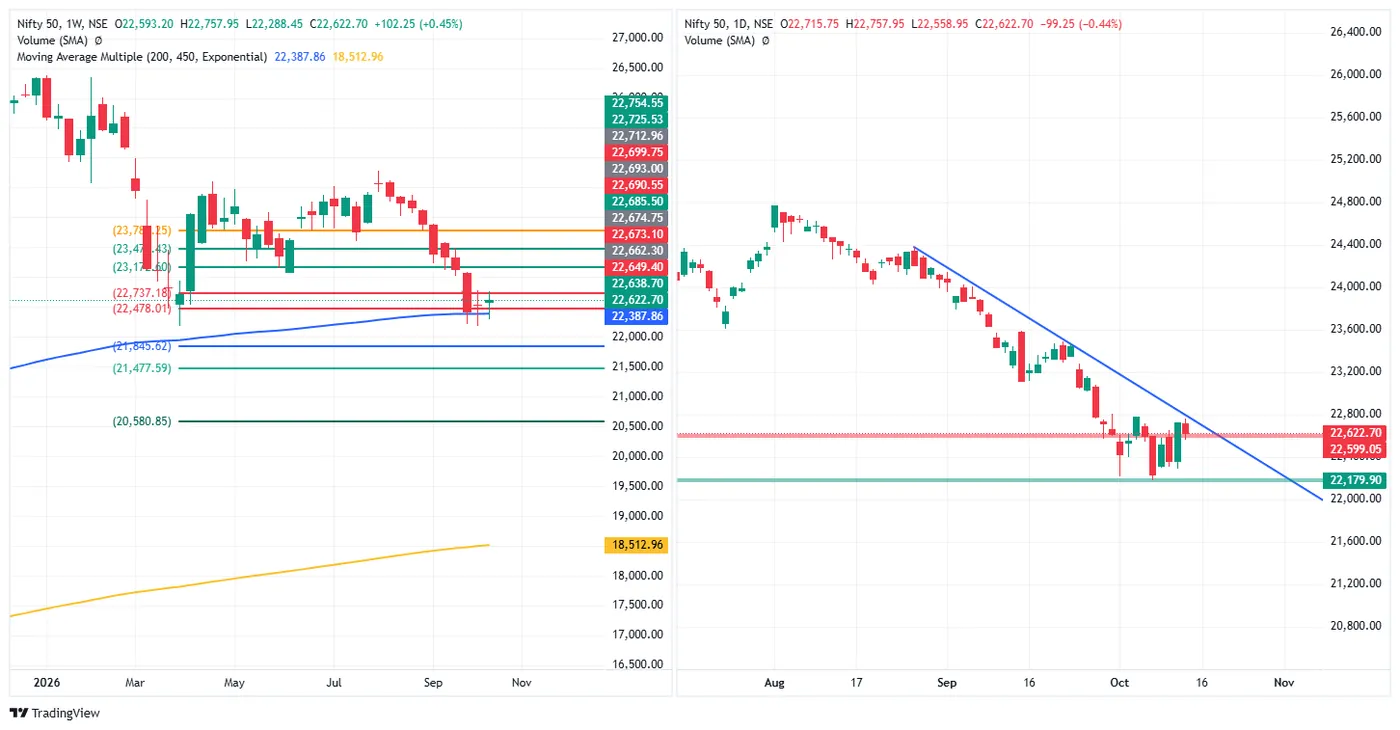
Close 22,622.70, down 99.25 (−0.44%), open 22,715.75, high 22,757.95, low 22,558.95.
The week so far (three sessions). Monday closed 22,363.35, down 157.10 (−0.70%), low 22,304.45. Tuesday closed 22,721.95, up 358.60 (+1.60%) at its high of the day, from a low of 22,288.45. Wednesday opened 6.20 below that and closed at 32.0% of a 199.00-point range. Week to date: +102.25 (+0.45%), high 22,757.95, low 22,288.45, closing 71.2% up the range.
At the falling trendline. The descending trendline drawn from late August runs near 22,700–22,760 at this point (read off the chart). Wednesday's high of 22,757.95 reached it and the session closed 135.25 below that high. The weekly mark at 22,737.18 sits in the same area; Wednesday's high went 20.77 above it and the close is 114.48 below it.
Below. The daily mark at 22,599.05 is 23.65 under the close. The October support line at 22,179.90 is 442.80 below; Tuesday's low of 22,288.45 stopped 108.55 above it. Weekly marks further down: 22,478.01, 21,845.62, 21,477.59.
The 200-week average. The week is trading 234.84 above the 200-week EMA (22,387.86), 1.05%, the second consecutive week above it after closing back over it on 9 October.
SENSEX — 14 October 2026
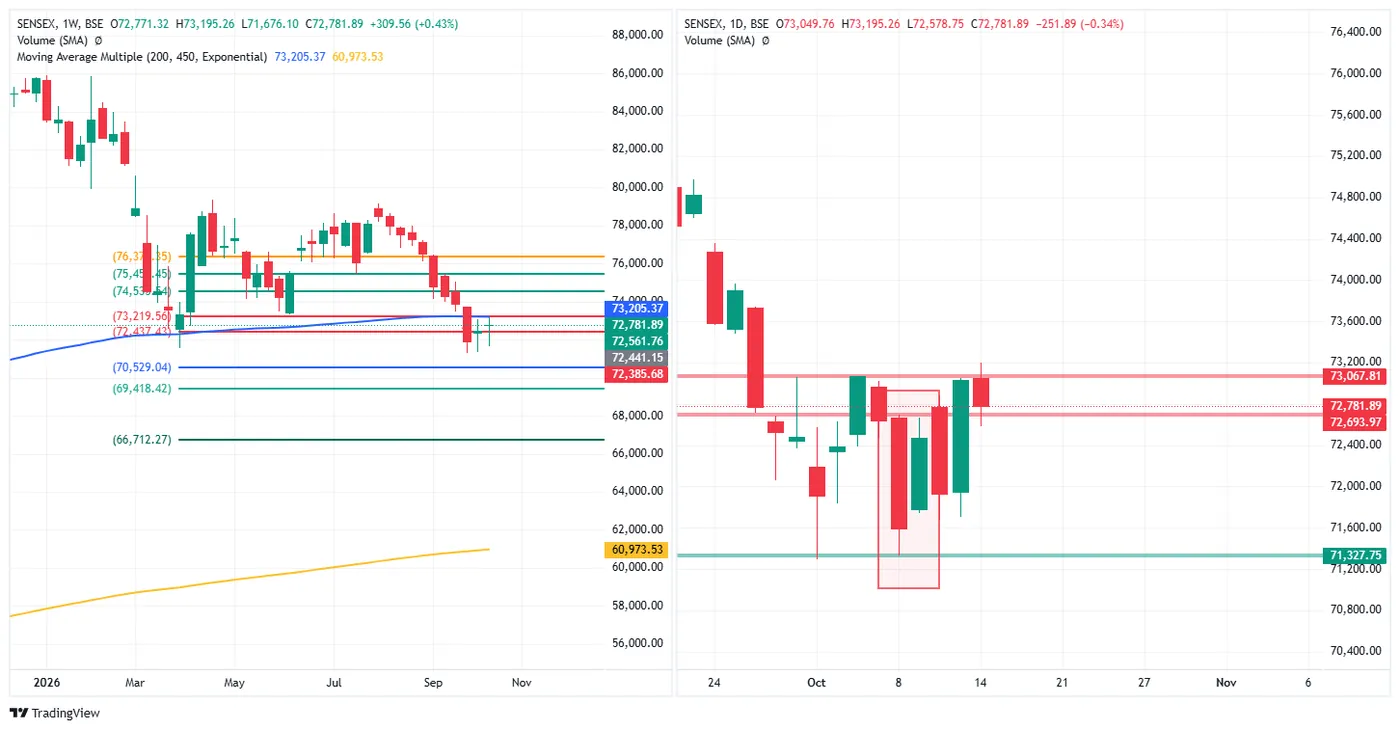
Close 72,781.89, down 251.89 (−0.34%), open 73,049.76, high 73,195.26, low 72,578.75.
Monday 71,924.68 (−547.65, −0.76%); Tuesday 73,033.78 (+1,109.10, +1.54%). Week to date +309.56 (+0.43%), high 73,195.26, low 71,676.10, closing 72.8% up the range. Wednesday closed at 32.9% of its own range.
At the 200-week average. Wednesday's high of 73,195.26 stopped 10.11 below the 200-week EMA (73,205.37). The close is 423.48 below it (0.58%). On 9 October the Sensex was 737.29 below the same line.
Daily marks. Above, 73,067.81: Wednesday's high went 127.45 over it and the close came back 285.92 under it. Below, 72,693.97, 87.92 under the close, then 71,327.75, the October low area. Weekly marks: 73,219.56 above; 72,437.43, 70,529.04 and 69,418.42 below.
BANK NIFTY — 14 October 2026
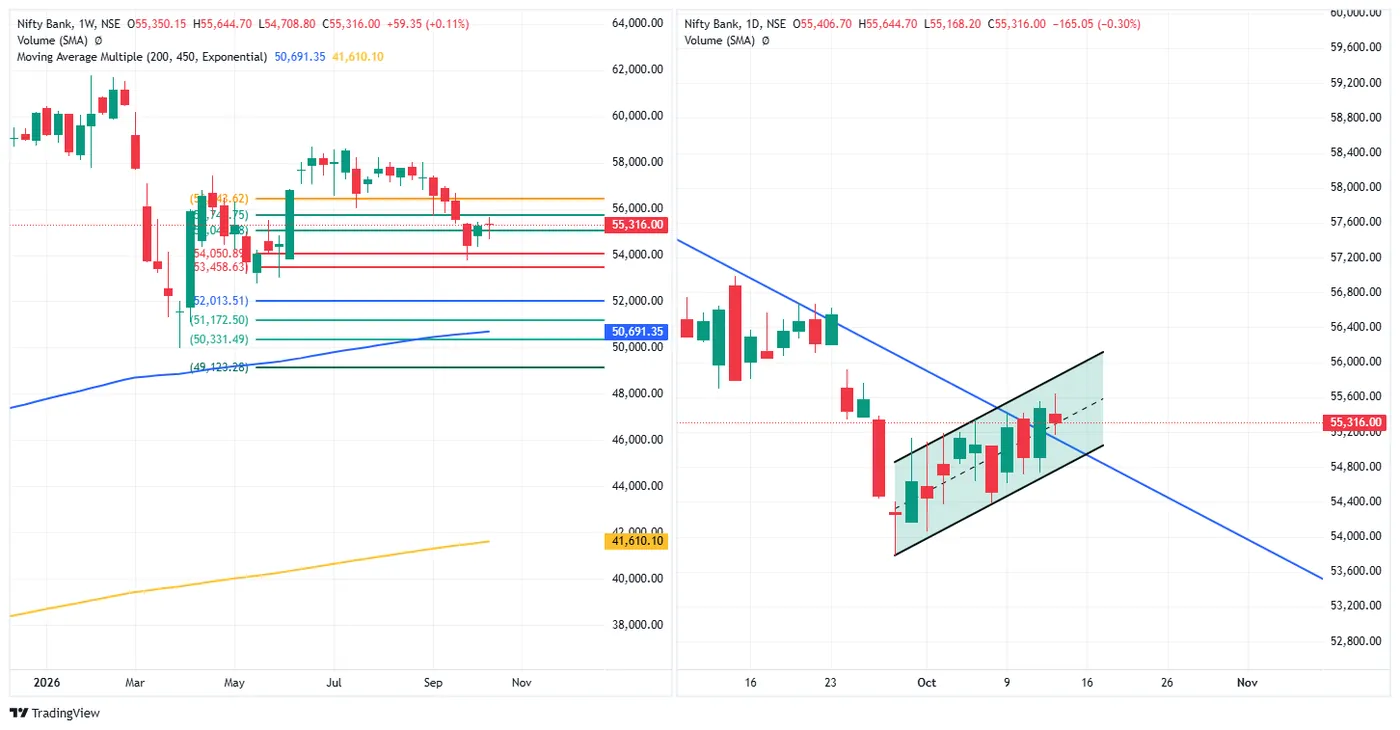
Close 55,316.00, down 165.05 (−0.30%), open 55,406.70, high 55,644.70, low 55,168.20.
Monday 54,918.00 (−338.65, −0.61%); Tuesday 55,481.05 (+563.05, +1.03%). Week to date +59.35 (+0.11%), high 55,644.70, low 54,708.80, closing 64.9% up the range. Wednesday closed at 31.0% of its range.
Above the trendline, inside the channel. Tuesday closed above the descending trendline from August that capped the index last week, and Wednesday's low (55,168.20) stayed above it (trendline position read off the chart). Price remains inside the rising channel from the late-September low, around its midline. Wednesday's high of 55,644.70 is the highest level since the channel began.
Weekly marks. Above: roughly 55,745 (label partly hidden) and 56,443.62. Below: roughly 55,040, then 54,050.89 and 53,458.63. The 200-week EMA is at 50,691.35, 4,624.65 below.
NIFTY FIN SERVICE — 14 October 2026
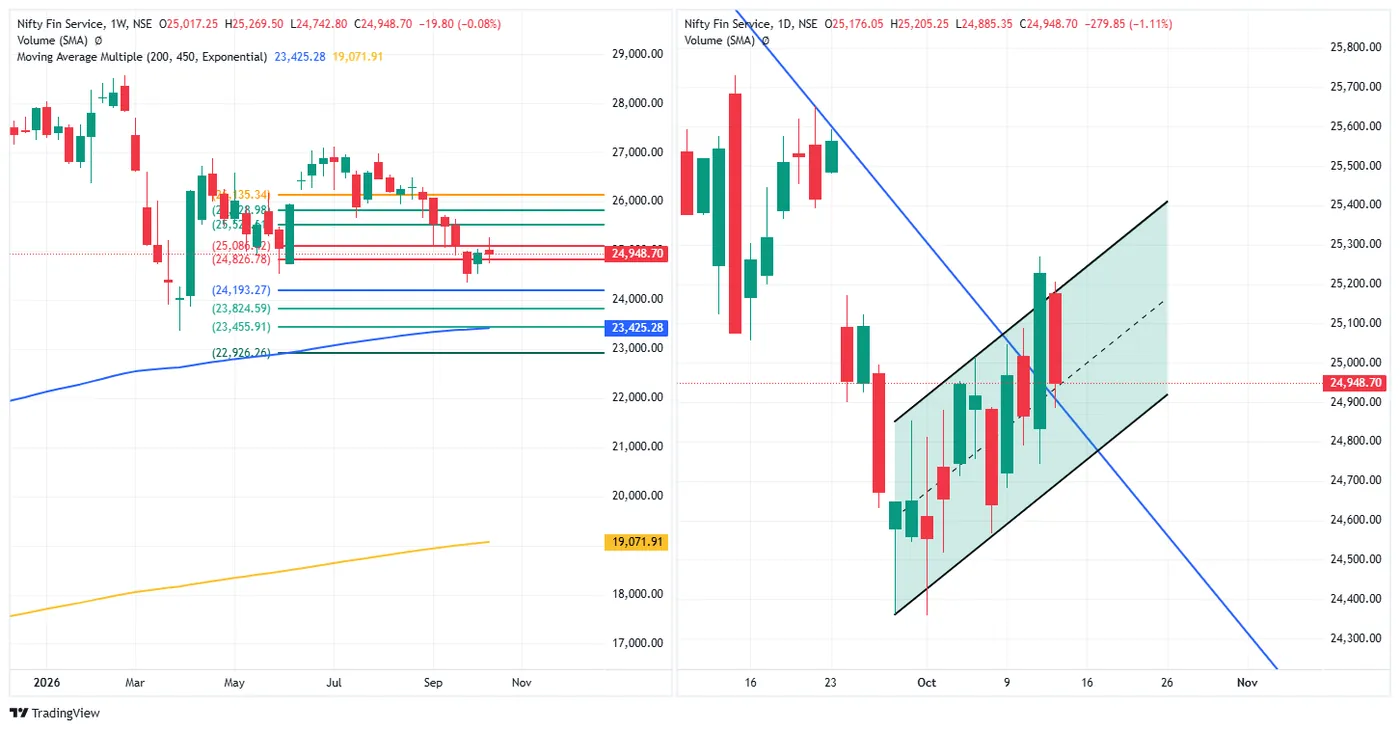
Close 24,948.70, down 279.85 (−1.11%), open 25,176.05, high 25,205.25, low 24,885.35 — the largest fall of the equity indices on Wednesday.
Tuesday closed 25,228.55. Week to date −19.80 (−0.08%), high 25,269.50, low 24,742.80, closing 39.1% up the range — the only equity index lower on the week. Wednesday closed at 19.8% of its range.
Tuesday above the trendline, Wednesday back to it. Tuesday's candle crossed the falling trendline and reached the top of the rising channel (week high 25,269.50). Wednesday opened below Tuesday's close and fell back to the area of the trendline and the channel midline (read off the chart).
Weekly marks. The close sits between 25,086.42 (137.72 above) and 24,826.78 (121.92 below). Further: roughly 25,520, 25,829 and 26,135.34 above; 24,193.27 and 23,824.59 below. 200-week EMA 23,425.28.
NIFTY MIDCAP SELECT — 14 October 2026
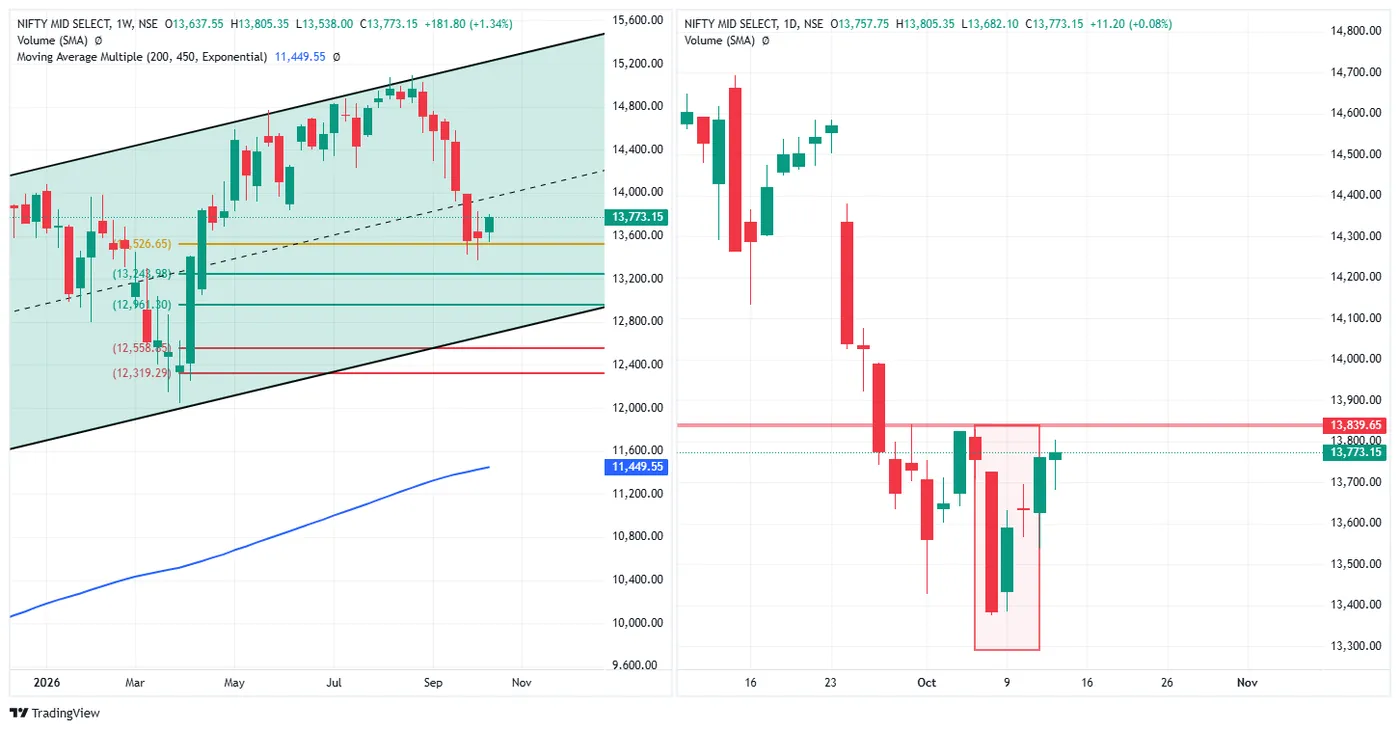
Close 13,773.15, up 11.20 (+0.08%), open 13,757.75, high 13,805.35, low 13,682.10 — the only equity index up on Wednesday.
Week to date +181.80 (+1.34%), high 13,805.35, low 13,538.00, closing 88.0% up the range — the largest weekly gain and the highest weekly close position of the equity indices. Last week it had the smallest gain and the lowest close position.
Under the October mark. The daily mark at 13,839.65 is 66.50 above the close; the week's high stopped 34.30 short of it. The weekly mark near 13,527 is 246.50 below. Price is still in the lower half of the weekly rising channel, below its dashed midline.
CRUDE OIL (MCX, 19 Oct fut) — 14 October 2026
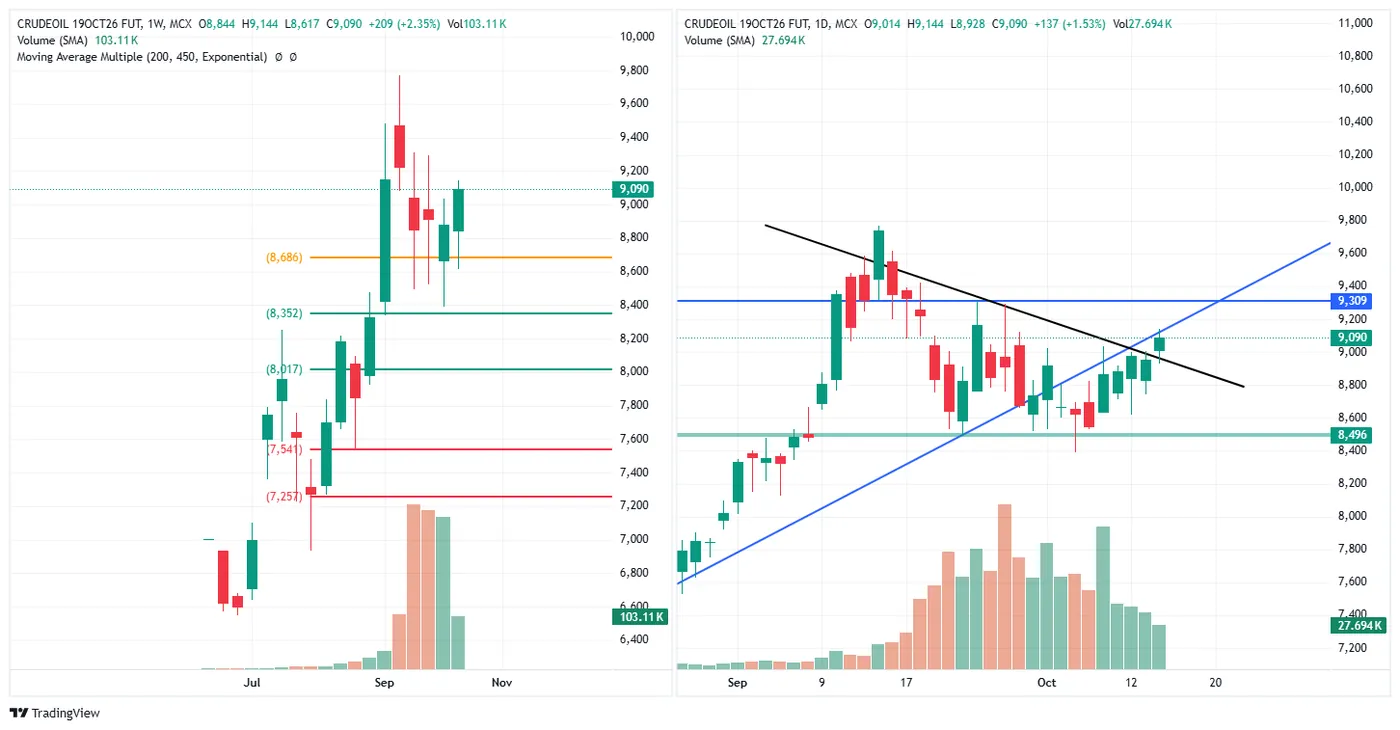
Close 9,090, up 137 (+1.53%), open 9,014, high 9,144, low 8,928. Volume 27.694K.
Week to date +209 (+2.35%), high 9,144, low 8,617, closing 89.8% up the range. Weekly volume 103.11K.
Back above both lines. Wednesday closed above the falling line from the September peak and back above the rising line from August that price slipped under in early October; the two cross at about this level (read off the chart). The daily mark at 9,309 is 219 above; 8,496 is 594 below.
Volume. Wednesday's 27.694K is the lowest daily volume of the recent bars shown. The October contract expires on 19 October, so part of the volume has moved to the next contract.
GOLD (MCX, 4 Dec fut) — 14 October 2026
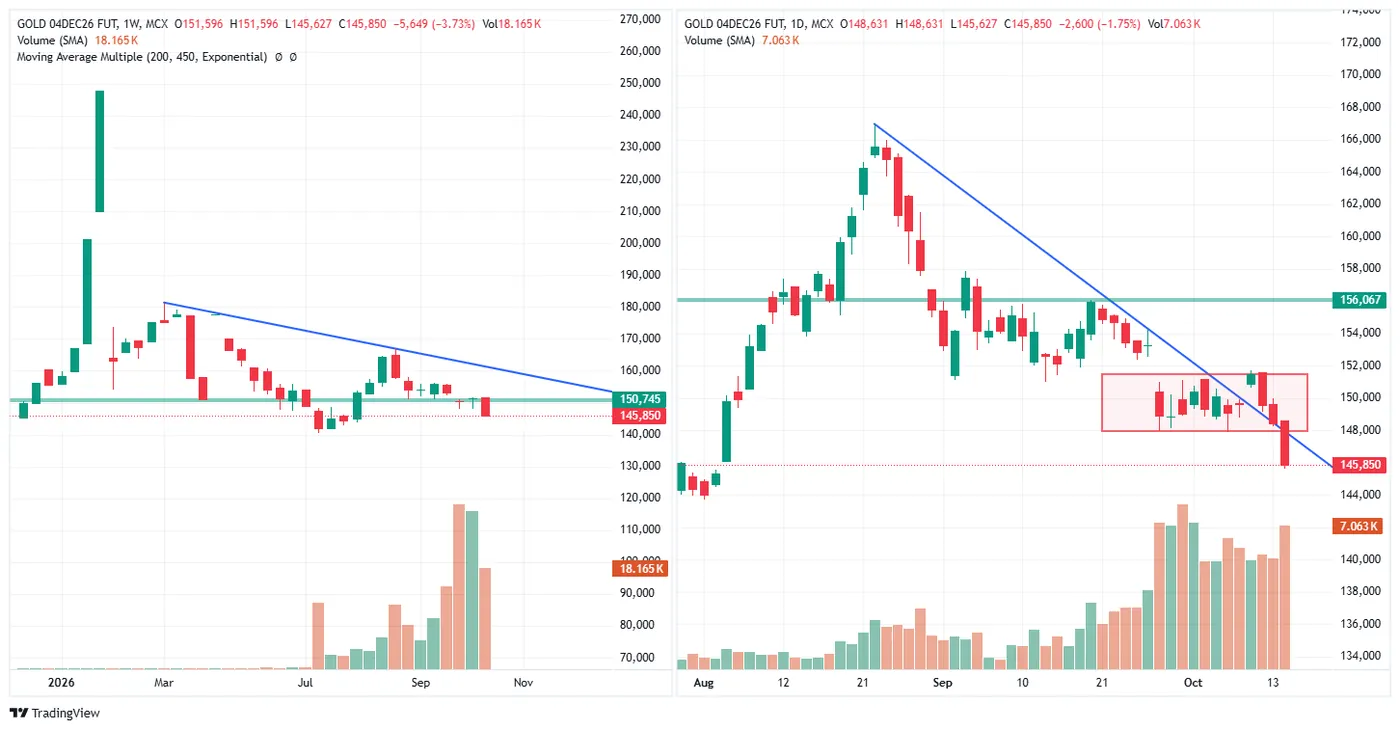
Close 145,850, down 2,600 (−1.75%), open 148,631, high 148,631, low 145,627. Volume 7.063K.
Week to date −5,649 (−3.73%), high 151,596, low 145,627. The week's high is the week's open: price has not traded above Friday's level this week.
Out of the box, downward. On 9 October gold closed at the top of its two-week box (about 147,900–151,500) and above the daily falling trendline. This week it fell back through the box and closed below its lower edge, 3.7% up the week's range and 7.4% up Wednesday's. The weekly mark at 150,745 is 4,895 above the close. Wednesday's volume (7.063K) is higher than the previous several sessions.
SILVER (MCX, 4 Dec fut) — 14 October 2026
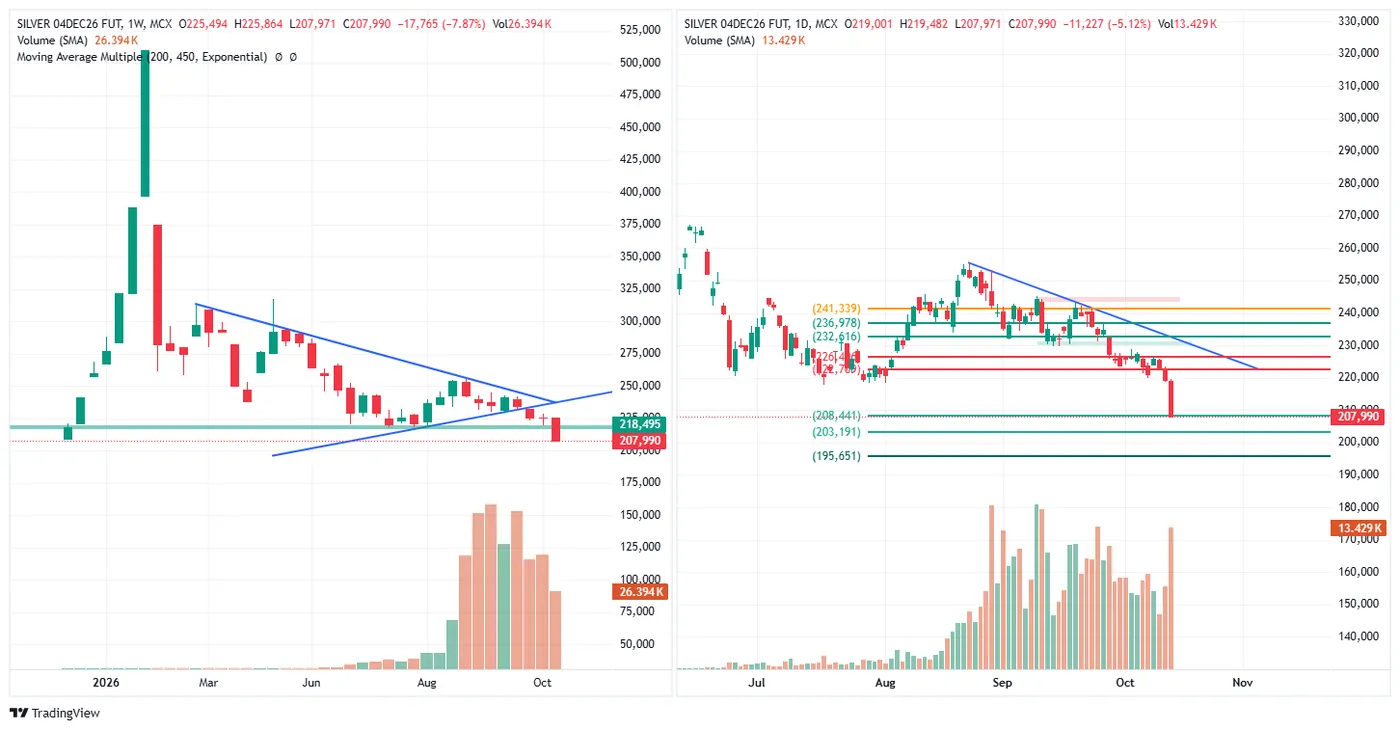
Close 207,990, down 11,227 (−5.12%), open 219,001, high 219,482, low 207,971. Volume 13.429K.
Week to date −17,765 (−7.87%), high 225,864, low 207,971. Both Wednesday and the week closed at their lows (0.2% and 0.1% up their ranges).
Below the weekly level. The weekly chart's horizontal mark at 218,495 — the level price held through the summer — is now 10,505 above the close. This follows the late-September break below the weekly symmetrical triangle.
Daily marks. The close is at 208,441 (451 above it); further marks at 203,191 and 195,651. Above: roughly 222,700, 226,400, then 232,616, 236,978 and 241,339. Wednesday's volume (13.429K) is the highest of the recent bars shown.
Read across the session
| Wednesday | Closed in its range | Week to date | Up its weekly range | |
|---|---|---|---|---|
| Crude oil (Oct) | +1.53% | 75.0% | +2.35% | 89.8% |
| Nifty Midcap Select | +0.08% | 73.9% | +1.34% | 88.0% |
| Sensex | −0.34% | 32.9% | +0.43% | 72.8% |
| Nifty 50 | −0.44% | 32.0% | +0.45% | 71.2% |
| Bank Nifty | −0.30% | 31.0% | +0.11% | 64.9% |
| Nifty Fin Service | −1.11% | 19.8% | −0.08% | 39.1% |
| Gold (Dec) | −1.75% | 7.4% | −3.73% | 3.7% |
| Silver (Dec) | −5.12% | 0.2% | −7.87% | 0.1% |
Tuesday up, Wednesday back. Every equity index rose on Tuesday (Nifty +1.60%, Sensex +1.54%) and every one except Midcap Select gave part of it back on Wednesday, closing in the lower third of the day.
The large caps met their lines. The Nifty's high reached its falling trendline; the Sensex's high stopped 10.11 short of its 200-week EMA. Both closed below those levels.
The order changed. Last week financials led and midcaps lagged. This week to date Midcap Select leads (+1.34%) and Fin Service is the only equity index lower (−0.08%).
Metals reversed. Gold and silver both closed at the low of the week after last Friday's rally — gold back below its box, silver below its weekly level — while crude closed near the top of its week.
What the institutional flow did
| FII net | DII net | Net | DII cover | |
|---|---|---|---|---|
| 12 Oct | −₹1,708.48 Cr | +₹3,045.02 Cr | +₹1,336.54 Cr | 1.78× |
| 13 Oct | −₹1,305.13 Cr | +₹2,439.24 Cr | +₹1,134.11 Cr | 1.87× |
| 14 Oct | −₹1,857.44 Cr | +₹2,670.44 Cr | +₹813.00 Cr | 1.44× |
| Week to date | −₹4,871.05 Cr | +₹8,154.70 Cr | +₹3,283.65 Cr | 1.67× |
Foreign selling slowed sharply. FIIs sold ₹4,871.05 Cr across three sessions, an average of ₹1,623.68 Cr a day, against ₹6,058.86 Cr a day last week (₹30,294.29 Cr over five sessions). Domestic institutions bought more than FIIs sold on every day this week, so the net has been positive each session — last week it was negative on two of five.
F&O positioning
FII net position by segment, in contracts (calls long and puts short count as long; puts long and calls short as short). NSE's participant files for 13 and 14 October were not yet in the record when this was written, so the latest reading is Monday's:
| 9 Oct | 12 Oct | Change | |
|---|---|---|---|
| Index futures | −293,988 | −295,860 | −1,872 |
| Index options | −887,310 | −948,209 | −60,899 |
| Stock futures | +675,468 | +685,578 | +10,110 |
| Stock options | −279,854 | −306,374 | −26,520 |
| Net | −785,684 | −864,865 | −79,181 |
Monday's book was more short than Friday's, mostly through index options (−60,899). Index futures were almost unchanged at −295,860, and stock-futures longs rose again to 685,578, the largest in the record so far. Clients were net long 5,898,704 contracts.
The standing limits apply: these are net figures across all participants in a category, a few sessions are not a rule, and positions published after the close cannot have caused the candles that produced them.
Descriptive commentary on price structure and marked levels. It is not advice, not a recommendation, and contains no targets or entry levels. NEOGreeks is not a SEBI-registered investment adviser.