NIFTY 50 — 1 October 2026
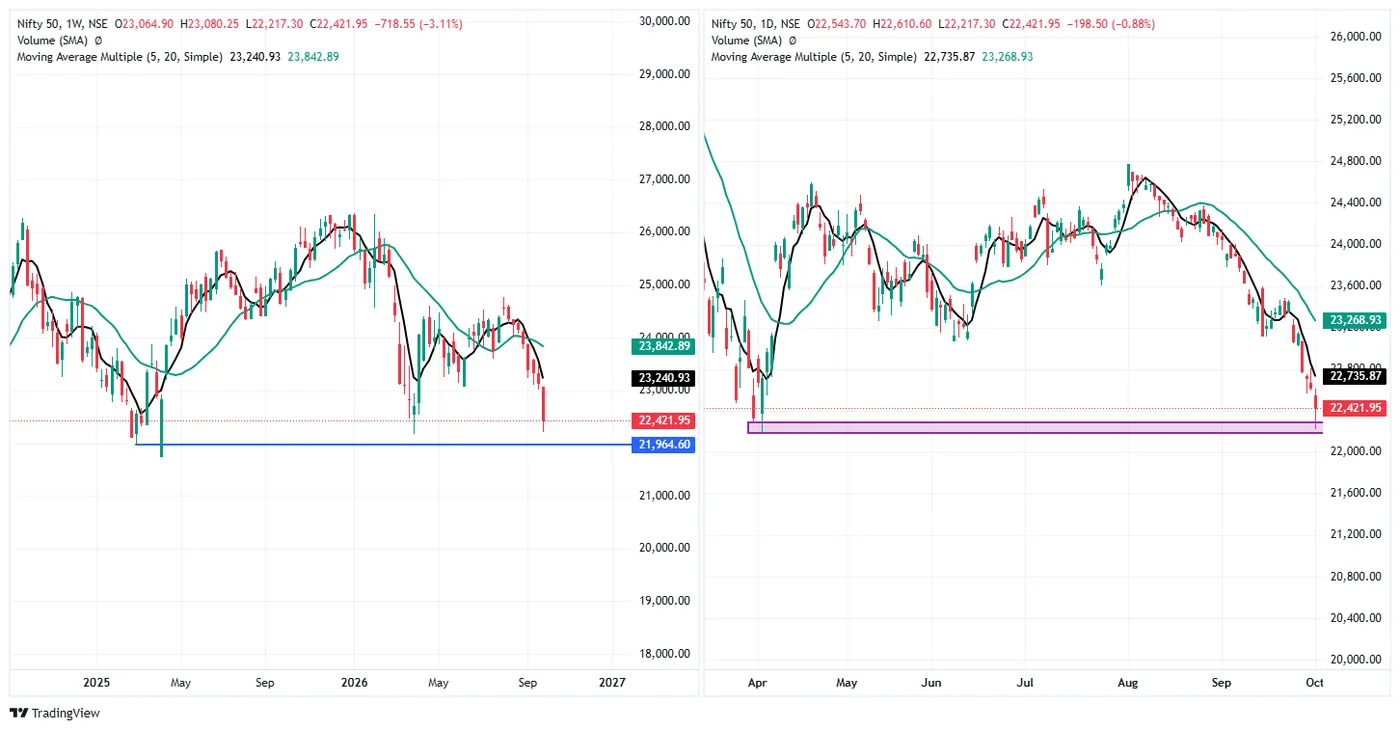
Close 22,421.95, down 198.50 (−0.88%), open 22,543.70, high 22,610.60, low 22,217.30.
Week ending Thursday. Markets were shut on Friday, 2 October, so Thursday's candle also closes the week. Wednesday is reconstructed from Thursday's change: it closed 22,620.45, down 95.75 (−0.42%) from Tuesday's 22,716.20. Thursday then opened 76.75 lower.
The April low held again. Thursday's low of 22,217.30 stopped inside the shaded band drawn from the 2 April low, the same zone that held the April sell-off. The close came back to 52.0% of a 393.30-point range, and the candle has the hammer shape: a lower shadow of 204.65, 1.7 times the 121.75 body, with a 66.90 upper shadow. (A textbook hammer wants the lower shadow at twice the body or more, so this is close to the pattern rather than a strict one.) It is the second time this band has produced a long lower shadow.
Below the band. The next marked level is 21,964.60, the weekly line from the 2025 low. It is 457.35 below the close (2.04%), and Thursday's low stopped 252.70 above it.
Averages. 313.92 below the 5-day average (22,735.87) and 846.98 below the 20-day (23,268.93) — 3.78% of price, the widest of the large-cap indices. On the weekly chart, 818.98 below the 5-week (23,240.93) and 1,420.94 below the 20-week (23,842.89).
The week was −3.11% (−718.55), the largest weekly fall of the large caps, closing 23.7% of the way up an 862.95-point weekly range. Thursday's low was also the week's low.
SENSEX — 1 October 2026
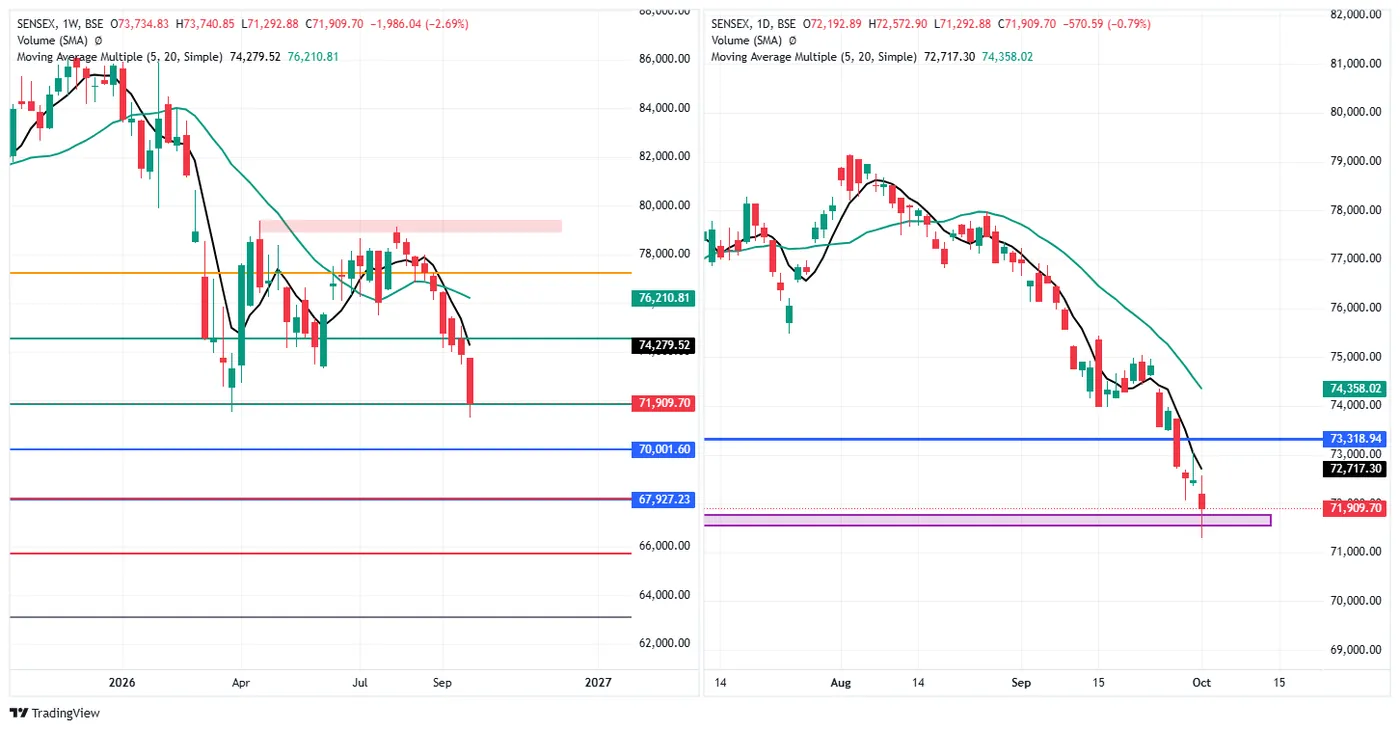
Close 71,909.70, down 570.59 (−0.79%), open 72,192.89, high 72,572.90, low 71,292.88.
Wednesday: 72,480.29, down 48.78 (−0.07%). Thursday opened 287.40 lower.
Same test as the Nifty, a wider candle. The low went below the shaded band from the April low and the close came back above it. The lower shadow is 616.82, 2.2 times the 283.19 body, but there is also a 380.01-point upper shadow, so the candle is two-sided rather than a clean hammer. It closed 48.2% up a 1,280.02-point range.
Below. The next marked level is 70,001.60, 1,908.10 below the close (2.65%); Thursday's low stopped 1,291.28 above it. Further marks at 67,927.23 and roughly 66,000. Above, the daily line at 73,318.94 is 1,409.24 overhead.
Averages. 807.60 below the 5-day (72,717.30) and 2,448.32 below the 20-day (74,358.02), 3.40% of price. Weekly: 2,369.82 below the 5-week (74,279.52) and 4,301.11 below the 20-week (76,210.81).
The week was −2.69% (−1,986.04), 25.2% up a 2,447.97-point range. As with the Nifty, Thursday's low was the week's low.
BANK NIFTY — 1 October 2026
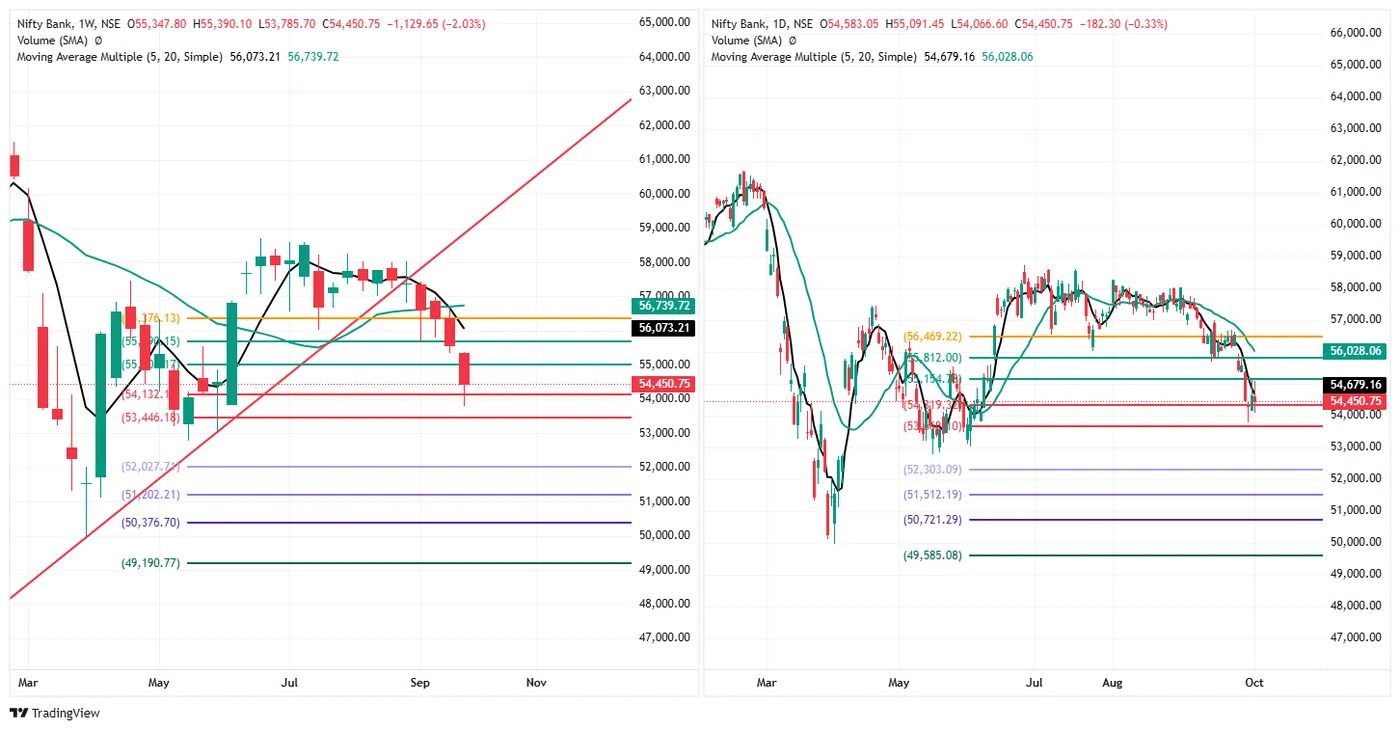
Close 54,450.75, down 182.30 (−0.33%), open 54,583.05, high 55,091.45, low 54,066.60.
Wednesday: 54,633.05, up 373.10 (+0.69%) — the only large-cap index up on Wednesday.
The strongest of the three large caps, by every measure on these charts.
- It did not make a new low. Thursday's low was 280.90 above Tuesday's 53,785.70, which remains the week's low. The Nifty and Sensex both made their week's low on Thursday.
- Closest to its averages. 228.41 below the 5-day (54,679.16), 0.42% of price, against 1.40% for the Nifty and 1.12% for the Sensex. 1,577.31 below the 20-day (56,028.06), 2.90%, against 3.78% and 3.40%.
- The smallest weekly fall: −2.03% (−1,129.65), closing 41.5% up a 1,604.40-point weekly range — the highest weekly close position of the equity indices.
Thursday itself was a weaker day: it reached 55,091.45, then closed 37.5% up a 1,024.85-point range, with a 508.40 upper shadow.
Structure. On the weekly chart it is below the rising trendline drawn from March, which price fell under in late August, and 1,622.46 below the 5-week average (56,073.21).
Marked levels (daily). Above 55,812.00 · 56,469.22. Below 52,303.09 · 51,512.19 · 50,721.29 · 49,585.08. Two marks between 53,600 and 55,200 are partly hidden by candles and are not quoted.
NIFTY MIDCAP SELECT — 1 October 2026
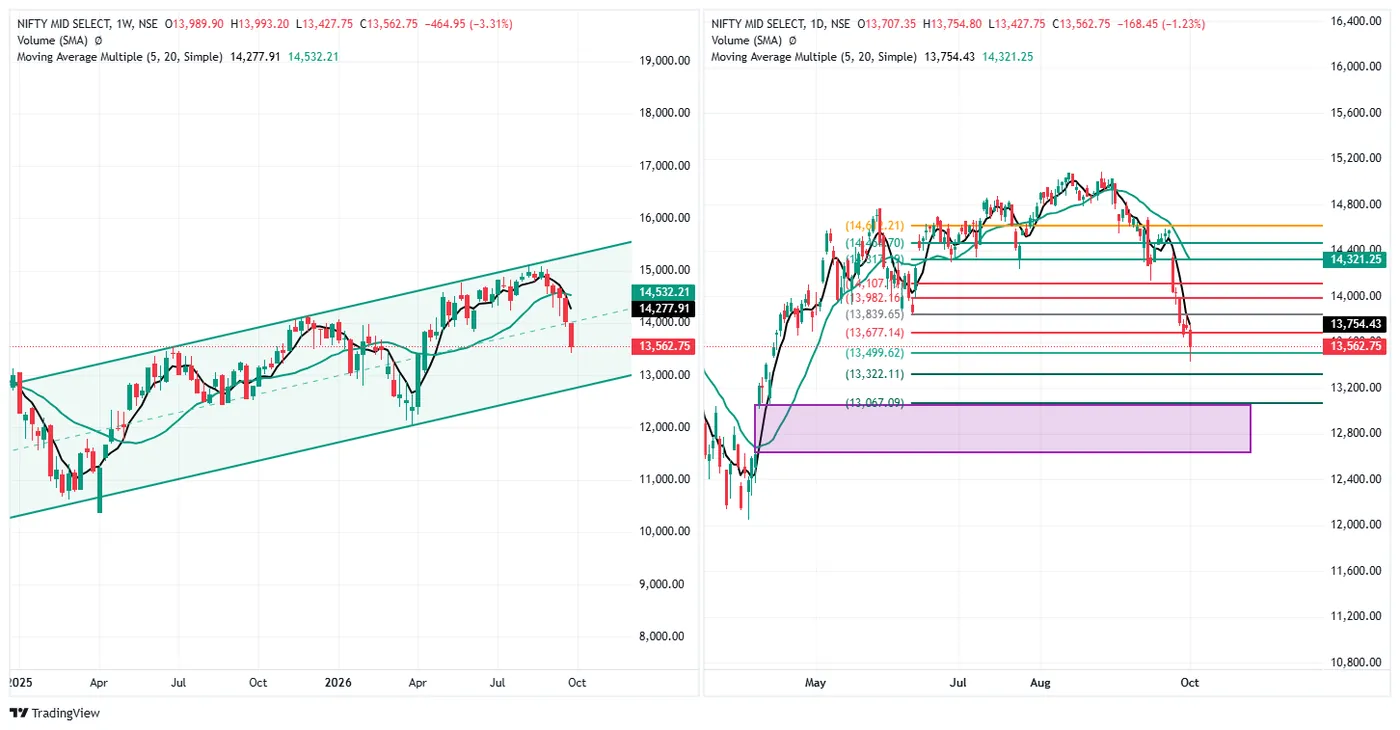
Close 13,562.75, down 168.45 (−1.23%), open 13,707.35, high 13,754.80, low 13,427.75.
Wednesday: 13,731.20, up 57.05 (+0.42%).
The biggest weekly fall here: −3.31% (−464.95), closing 23.9% up a 565.45-point weekly range.
Thursday broke the mark Tuesday closed on. The close is 114.39 below 13,677.14 and 63.13 above 13,499.62; the low went 71.87 under 13,499.62 before recovering. 41.3% up a 327.05-point range.
Still inside the weekly channel, falling through it. The rising channel from 2025 is intact, but price is now in its lower half, well below the dashed midline. The channel's lower line runs near 13,000 at this point (read off the chart, not labelled). That is also where the unfilled gap on the daily chart begins: it spans roughly 12,650–13,000. The last marked level above the gap is 13,067.09, 495.66 below the close (3.65%).
Averages. 191.68 below the 5-day (13,754.43) and 758.50 below the 20-day (14,321.25) — 5.59% of price, the largest gap to the 20-day of the equity indices. Weekly: 715.16 below the 5-week, 969.46 below the 20-week.
Marked levels. Above 13,677.14 · 13,839.65 · 13,982.16. Below 13,499.62 · 13,322.11 · 13,067.09.
CRUDE OIL (MCX, 19 Oct fut) — 1 October 2026
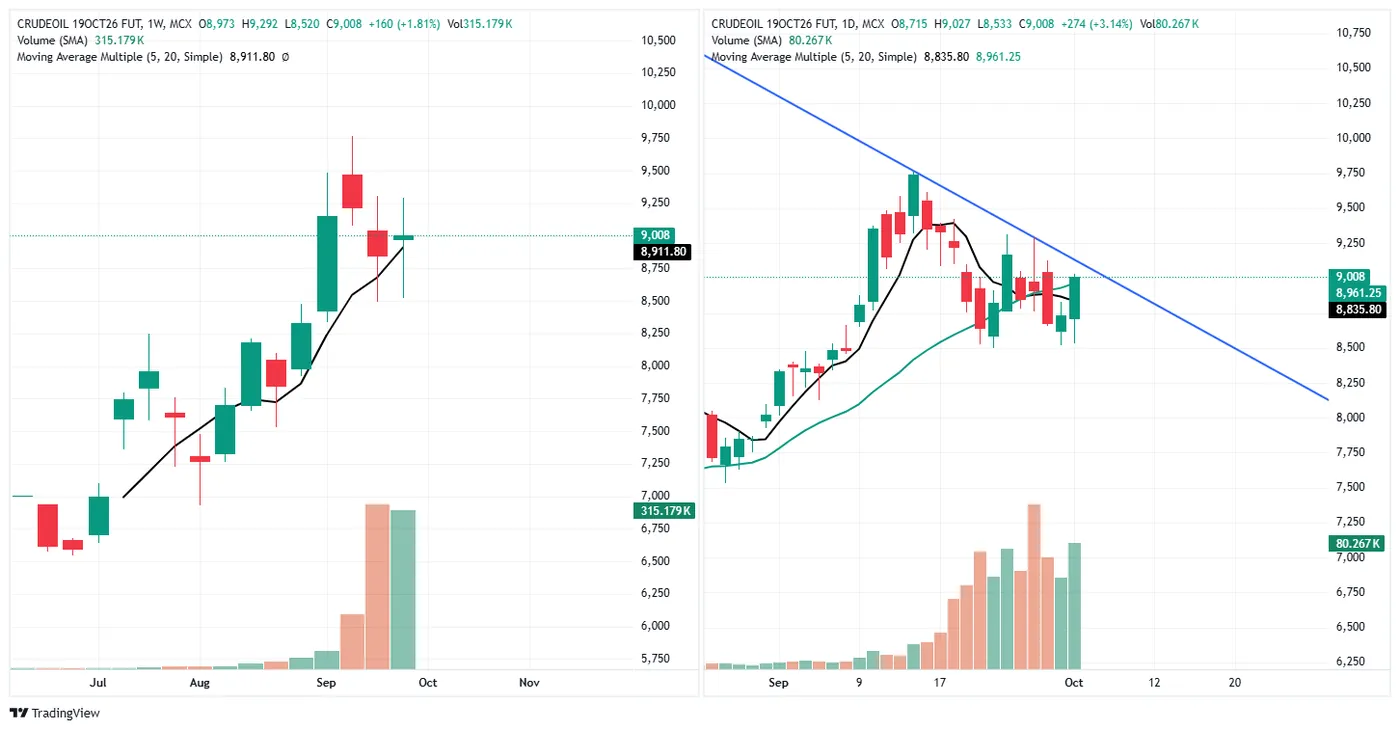
Close 9,008, up 274 (+3.14%), open 8,715, high 9,027, low 8,533. Volume 80.267K.
Wednesday: 8,734, up 59 (+0.68%) from Tuesday's 8,675.
It closed above both 5-period averages. 172.20 above the daily 5 (8,835.80) and 96.20 above the weekly 5 (8,911.80). It also closed 46.75 above the 20-day (8,961.25), which Tuesday's note had it 118.59 below. With Indian markets shut on Friday, this is the week's last print.
Closed at the high. 96.2% of the way up a 494-point range, 19 points off the top. Thursday's volume (80.267K) was above Tuesday's 71.228K.
What is still overhead. The descending trendline from the mid-September high on the daily chart sits just above the close, roughly 9,050–9,100 here (read off the chart). Thursday closed under it.
The week was +1.81% (+160), the only gain on this page. The weekly candle opened at 8,973 and closed at 9,008 — a 35-point body — with a 453-point lower shadow to the 8,520 low. 63.2% up a 772-point weekly range.
GOLD (MCX, 4 Dec fut) — 1 October 2026
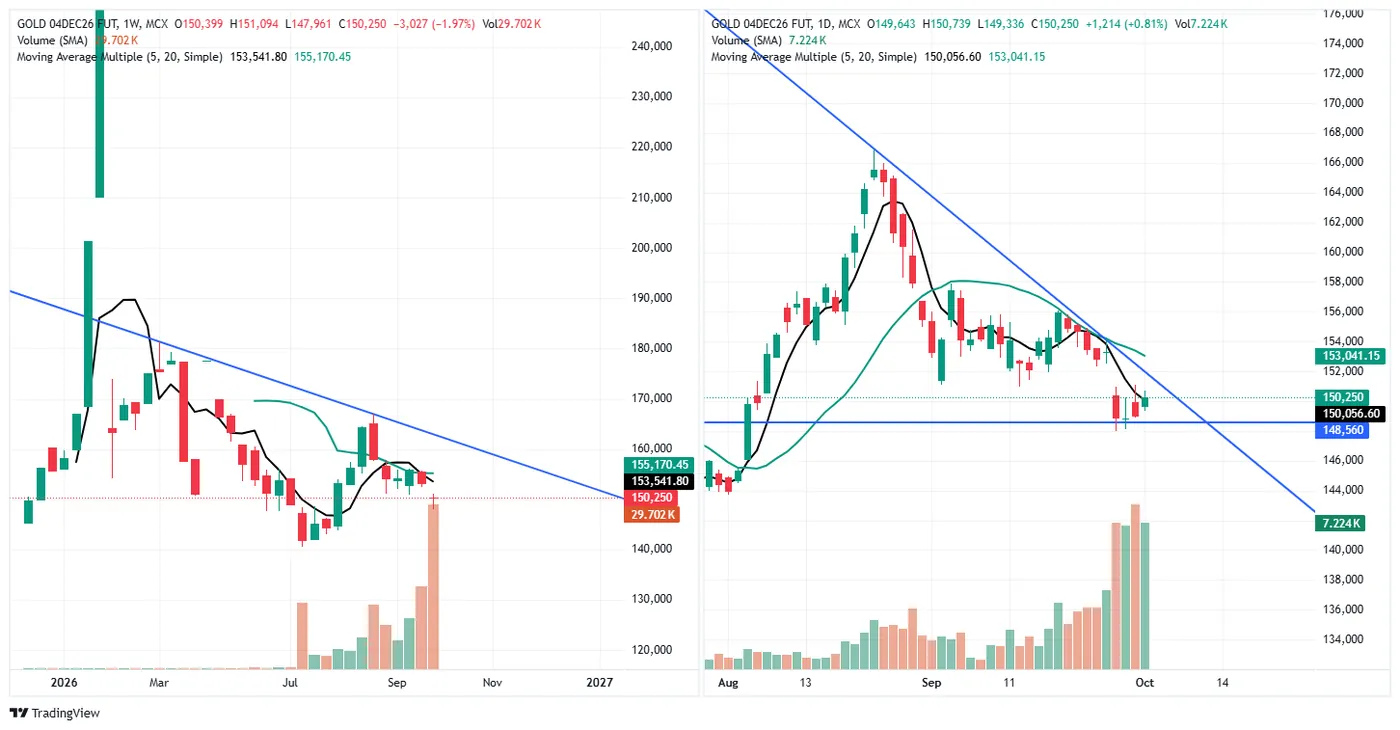
Close 150,250, up 1,214 (+0.81%), open 149,643, high 150,739, low 149,336. Volume 7.224K.
Wednesday: 149,036, up 239 (+0.16%) from Tuesday's 148,797.
Above the 5-day, below the trendline. 193.40 above the 5-day (150,056.60) but 2,791.15 below the 20-day (153,041.15). The descending trendline from the August high on the daily chart is just above the close, and Thursday's high reached it without closing above it.
The horizontal held. The week's low of 147,961 went 599 below the marked 148,560; the close is 1,690 above it.
The weekly candle has the same shape as crude's. It opened at 150,399 and closed at 150,250, a 149-point body, with a 2,289-point lower shadow, closing 73.1% up a 3,133-point range. The week still shows −1.97% (−3,027) because Monday opened well below the prior Friday's 153,277. Weekly volume (29.702K) is the tallest bar on the weekly chart. Price remains below the descending weekly trendline from the start of the year, and 3,291.80 below the 5-week average.
SILVER (MCX, 4 Dec fut) — 1 October 2026
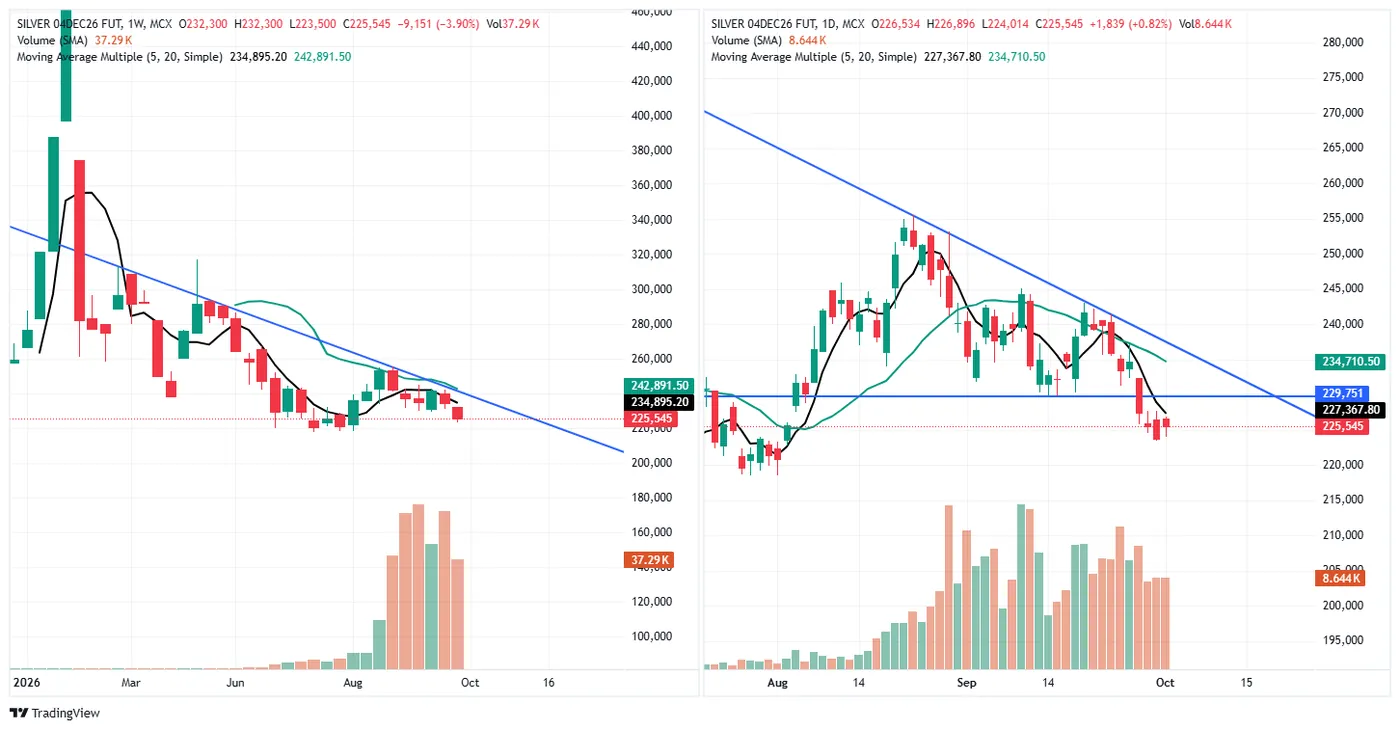
Close 225,545, up 1,839 (+0.82%), open 226,534, high 226,896, low 224,014. Volume 8.644K.
Wednesday: 223,706, down 1,494 (−0.66%).
Similar to gold on the day, not on the week. Thursday was an up close like gold's, but it opened 2,828 above Wednesday and closed 989 below its own open, 53.1% up a 2,882-point range. Unlike gold, it closed below its 5-day average, by 1,822.80 (227,367.80), and 9,165.50 below the 20-day (234,710.50).
Below the broken band. The marked 229,751, the line broken on Monday, is now 4,206 overhead. Both descending trendlines, daily from August and weekly from the start of the year, are above price.
The week was −3.90% (−9,151), the largest fall on this page, closing 23.2% up an 8,800-point range. Unlike crude and gold, the weekly candle is a full-bodied down candle (6,755-point body) rather than a long lower shadow.
Read across the session
| Thursday | Closed in its range | Week | Up its weekly range | |
|---|---|---|---|---|
| Crude oil (Oct) | +3.14% | 96.2% | +1.81% | 63.2% |
| Silver (Dec) | +0.82% | 53.1% | −3.90% | 23.2% |
| Gold (Dec) | +0.81% | 65.1% | −1.97% | 73.1% |
| Bank Nifty | −0.33% | 37.5% | −2.03% | 41.5% |
| Sensex | −0.79% | 48.2% | −2.69% | 25.2% |
| Nifty 50 | −0.88% | 52.0% | −3.11% | 23.7% |
| Nifty Midcap Select | −1.23% | 41.3% | −3.31% | 23.9% |
Commodities up, equities down. All three MCX contracts closed higher on Thursday and every equity index closed lower. Crude was the only weekly gain on the page and closed at the top of its day.
The equity lows were tested, not extended at the close. The Nifty and the Sensex both made their week's low on Thursday and closed near the middle of the day's range, with long lower shadows. Bank Nifty did not make a new low at all.
Distance below the 20-week average
| Below its 20-week average | % of price | |
|---|---|---|
| Nifty Midcap Select | 969.46 | 7.15% |
| Nifty 50 | 1,420.94 | 6.34% |
| Sensex | 4,301.11 | 5.98% |
| Bank Nifty | 2,288.97 | 4.20% |
Bank Nifty is the closest of the four to its 20-week line, the same ordering as on the daily averages.
What the institutional flow did
| FII net | DII net | Net | DII cover | |
|---|---|---|---|---|
| 15 Sep | −₹2,977.86 Cr | +₹2,686.05 Cr | −₹291.81 Cr | 0.90× |
| 24 Sep | −₹5,027.36 Cr | +₹4,301.18 Cr | −₹726.18 Cr | 0.86× |
| 25 Sep | −₹3,693.93 Cr | +₹2,838.17 Cr | −₹855.76 Cr | 0.77× |
| 29 Sep | −₹9,980.22 Cr | +₹6,952.71 Cr | −₹3,027.51 Cr | 0.70× |
| 1 Oct | −₹9,484.22 Cr | +₹10,041.84 Cr | +₹557.62 Cr | 1.06× |
Domestic buying covered the foreign selling in full for the first time in this table. Foreign selling stayed close to Tuesday's record, ₹9,484.22 Cr, but domestic institutions bought ₹10,041.84 Cr, the largest DII figure here, and the day's net was positive. 30 September is not shown: NSE publishes only the latest session and it was not captured that day.
F&O positioning
FII net position by segment, in contracts (calls long and puts short count as long; puts long and calls short as short):
| 29 Sep | 30 Sep | 1 Oct | Change since 29 Sep | |
|---|---|---|---|---|
| Index futures | −267,307 | −282,870 | −310,174 | −42,867 |
| Index options | −1,072,720 | −1,133,708 | −1,098,043 | −25,323 |
| Stock futures | +496,408 | +489,549 | +535,081 | +38,673 |
| Stock options | −203,007 | −214,871 | −231,763 | −28,756 |
| Net | −1,046,626 | −1,141,900 | −1,104,899 | −58,273 |
Index futures went more short on both days, by 42,867 contracts across the two sessions. Only 8.0% of FII index-futures open interest is now long (29,605 long against 339,779 short), from 8.6% on Tuesday. Thursday's overall book was slightly less short than Wednesday's, but that came from adding stock-futures longs and reducing index-options shorts, not from the index futures, which kept building short.
Clients sit on the other side, as usual: net long 5,642,884 contracts across the four segments on Thursday.
The standing limits apply: these are net figures across all participants in a category, three sessions are not a rule, and positions published after the close cannot have caused the candles that produced them.
Descriptive commentary on price structure and marked levels. It is not advice, not a recommendation, and contains no targets or entry levels. NEOGreeks is not a SEBI-registered investment adviser.