NIFTY 50 — 29 September 2026
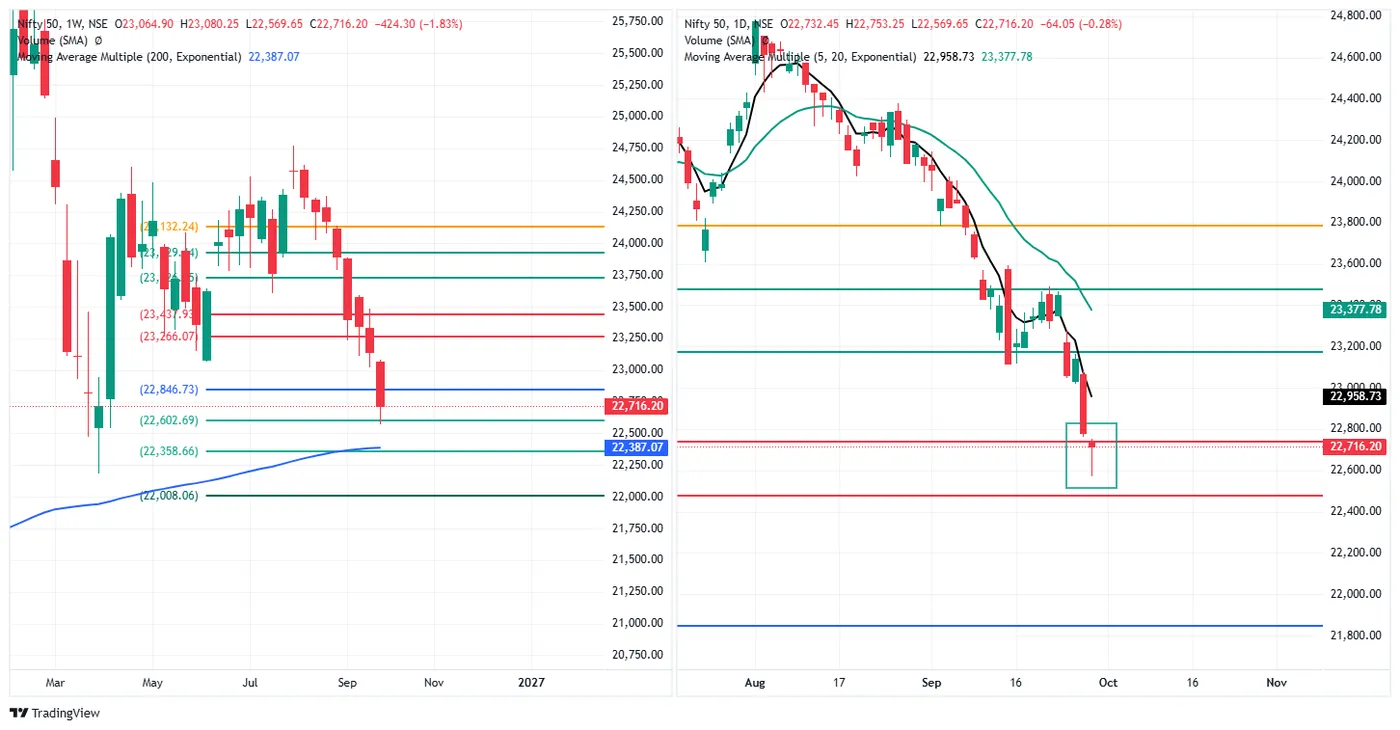
Close 22,716.20, down 64.05 (−0.28%), open 22,732.45, high 22,753.25, low 22,569.65.
Two sessions, one note. No charts were taken on Monday, so Monday is reconstructed from Tuesday's two changes: it closed 22,780.25, down 360.25 (−1.56%) from Friday's 23,140.50, having opened the week 75.60 lower. Tuesday opened a further 47.80 below that and finished 16.25 under its own open.
The level that held, just. Tuesday's low went 33.04 below the marked 22,602.69 and the close came back 113.51 above it, 79.8% of the way up a 183.60-point range. So the day tested the mark, traded through it, and did not close there. The mark above, 22,846.73, broke on Monday and is now 130.53 overhead.
The 200-week cushion has more than halved in two sessions. Price is 242.53 below the 5-day EMA (22,958.73), 661.58 below the 20-day (23,377.78), and 329.13 above the 200-week EMA (22,387.07) — 1.45% of price, down from 3.27% on Friday. Tuesday's low stopped 182.58 above it. The marked 22,358.66 sits 28.41 under the 200-week line itself, so the two are effectively one level.
The week so far is −1.83%, 28.7% of the way up its range.
Marked levels. Above 22,846.73 · 23,266.07 · 23,437.93 · 24,132.24. Below 22,602.69 · 22,358.66 · 22,008.06. Two further weekly marks between 23,700 and 24,000 are partly hidden by candles and are not quoted.
SENSEX — 29 September 2026
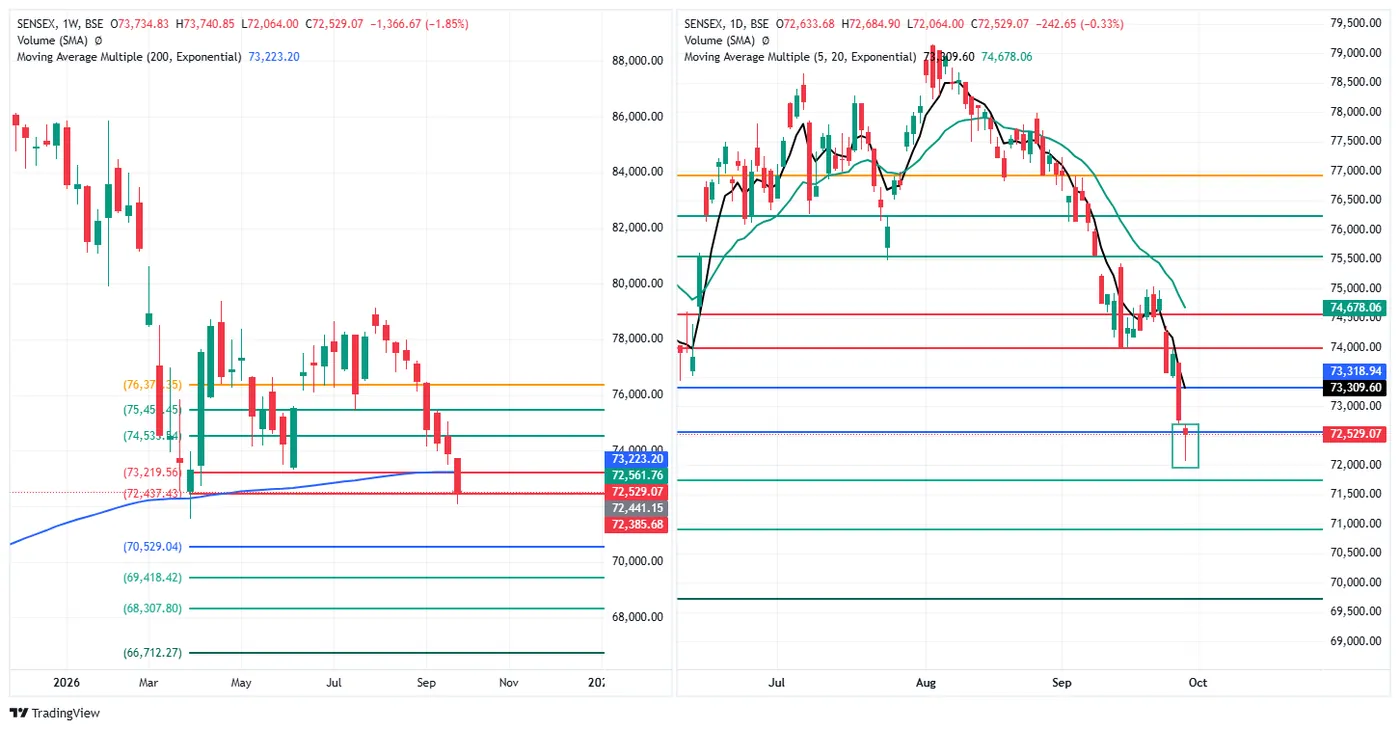
Close 72,529.07, down 242.65 (−0.33%), open 72,633.68, high 72,684.90, low 72,064.00.
Monday: 72,771.72, down 1,124.02 (−1.52%) from Friday's 73,895.74.
The Sensex is now below its 200-week EMA. The close is 694.13 under it (73,223.20) — −0.96% of price — and Tuesday's low was 1,159.20 under it. On Friday it was 0.90% above. The marked 73,219.56 sits 3.64 below the EMA, so the index has lost both at once, and they are now 690.49 overhead.
Correction to the 25 September note: it called the 200-week EMA "the line that has not been tested this year". That was wrong for the Sensex. Its weekly candles in late March and April traded down through that line; the April lows wicked beneath it. The Nifty's April lows did stay above its own 200-week line, so the statement held for the Nifty only.
Where it closed. 74.9% of the way up a 620.90-point range, 91.64 above the marked 72,437.43, which the low undercut by 373.43. Same shape as the Nifty: traded through the mark, closed back above it.
Short averages: 780.53 below the 5-day (73,309.60) and 2,148.99 below the 20-day (74,678.06). The week is −1.85%, 27.7% up its range.
Marked levels. Above 73,219.56 · 74,535.54 · 75,456.45. Below 72,437.43 · 70,529.04 · 69,418.42 · 68,307.80 · 66,712.27.
BANK NIFTY — 29 September 2026
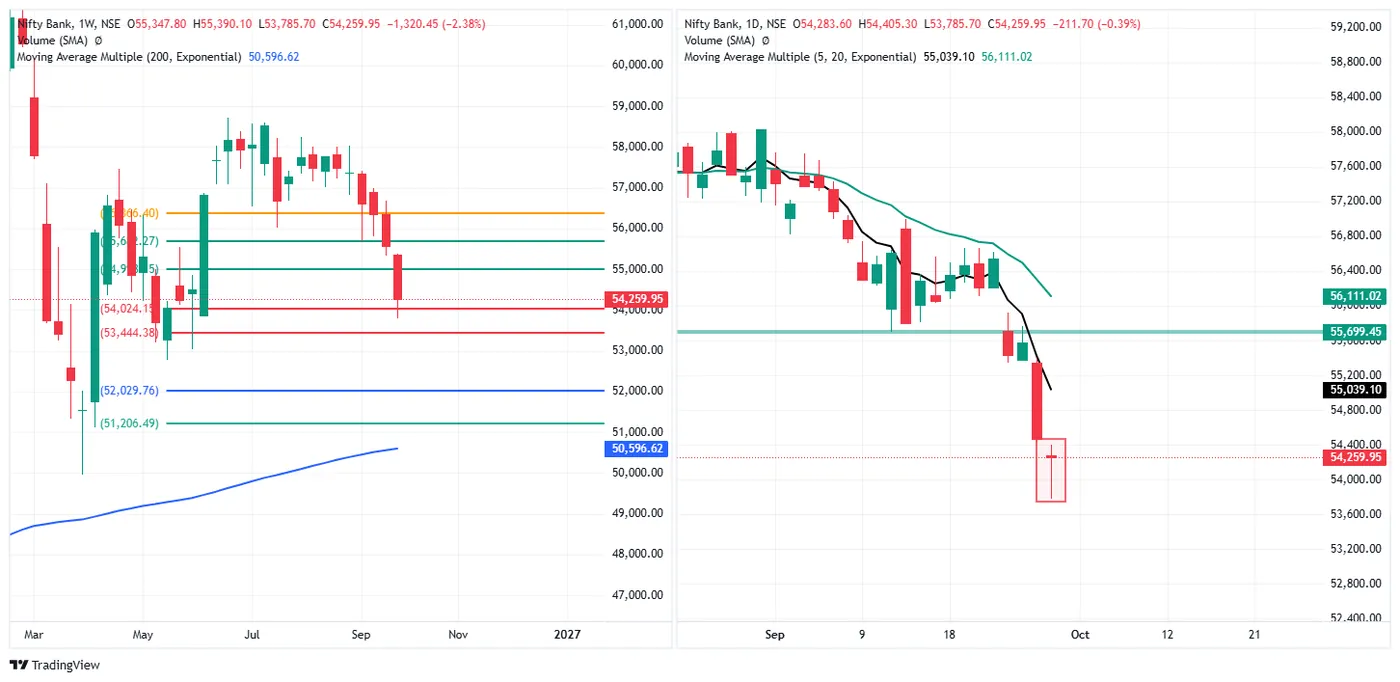
Close 54,259.95, down 211.70 (−0.39%), open 54,283.60, high 54,405.30, low 53,785.70.
Monday: 54,471.65, down 1,108.75 (−1.99%) — the largest Monday fall of the four large-cap indices, after a week in which it had been the first to stop falling.
The same test-and-reclaim as the Nifty and the Sensex. The low went 238.45 below the marked 54,024.15; the close was 235.80 above it, 76.5% of the way up a 619.60-point range. The horizontal at 55,699.45, which held through mid-September and was lost last week, is now 1,439.50 overhead.
Its cushion is still the widest of the large caps, but it is shrinking fastest in points. 779.15 below the 5-day (55,039.10), 1,851.07 below the 20-day (56,111.02), and 3,663.33 above the 200-week EMA (50,596.62) — 6.75% of price, from 9.03% on Friday.
The week is −2.38%, 29.6% up its range.
Marked levels. Above 55,699.45. Below 54,024.15 · 53,444.38 · 52,029.76 · 51,206.49. The upper weekly marks are partly hidden by candles and are not quoted.
NIFTY MIDCAP SELECT — 29 September 2026
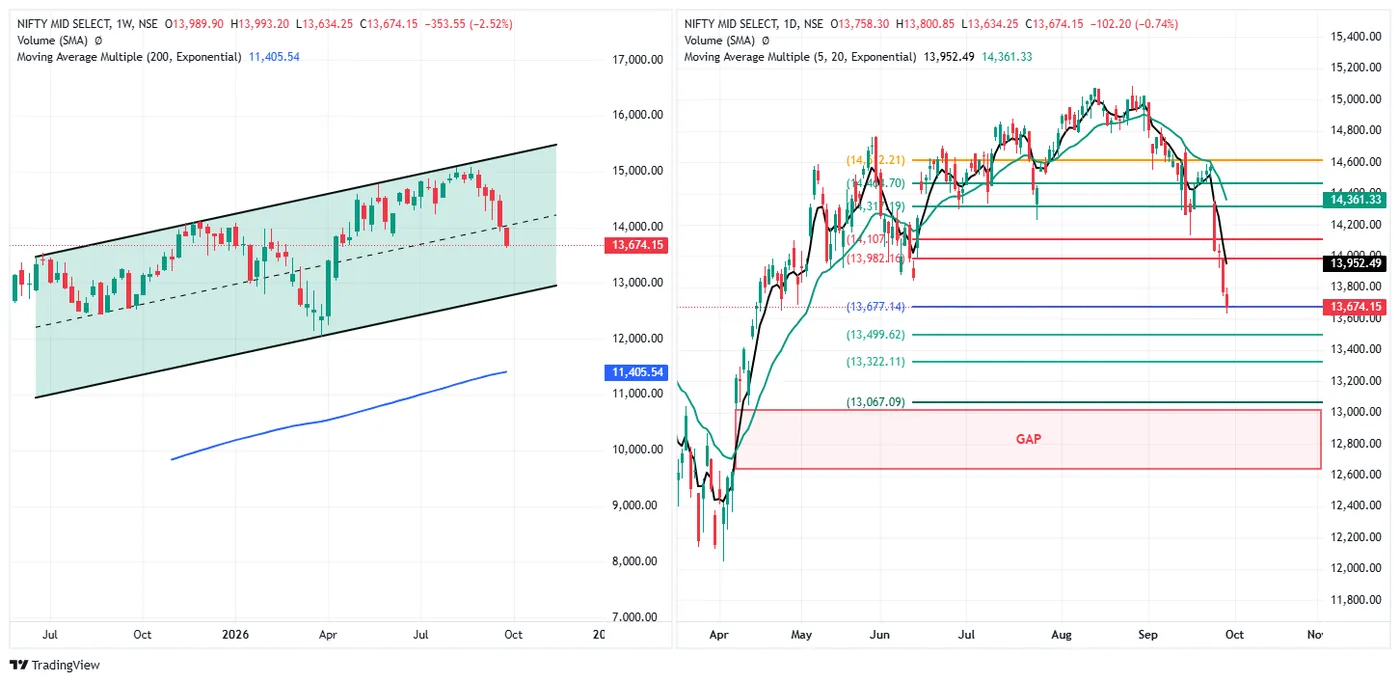
Close 13,674.15, down 102.20 (−0.74%), open 13,758.30, high 13,800.85, low 13,634.25.
Monday: 13,776.35, down 251.35 (−1.79%).
The one index that closed near its low. 23.9% of the way up a 166.60-point range and 84.15 below its own open, where the four large-cap indices all finished between 74.9% and 100% of theirs.
It closed on a mark, not above it — 2.99 below 13,677.14, with the low 42.89 under it. On the weekly chart the close is now in the lower half of the rising channel that runs from July 2025, where this chart begins, below its dashed midline. The unfilled gap drawn on the daily chart spans roughly 12,650–13,000 (read off the chart, not labelled).
Short averages: 278.34 below the 5-day (13,952.49) and 687.18 below the 20-day (14,361.33). Still 2,268.61 above its 200-week EMA (11,405.54) — 16.59% of price, from 18.86% on Friday.
The week is −2.52%, and at 11.1% of its weekly range it is the lowest of the equity indices on that measure, as it was on Friday.
Marked levels. Above 13,677.14 · 13,982.16. Below 13,499.62 · 13,322.11 · 13,067.09. Higher marks are partly hidden and not quoted.
NIFTY FIN SERVICE — 29 September 2026
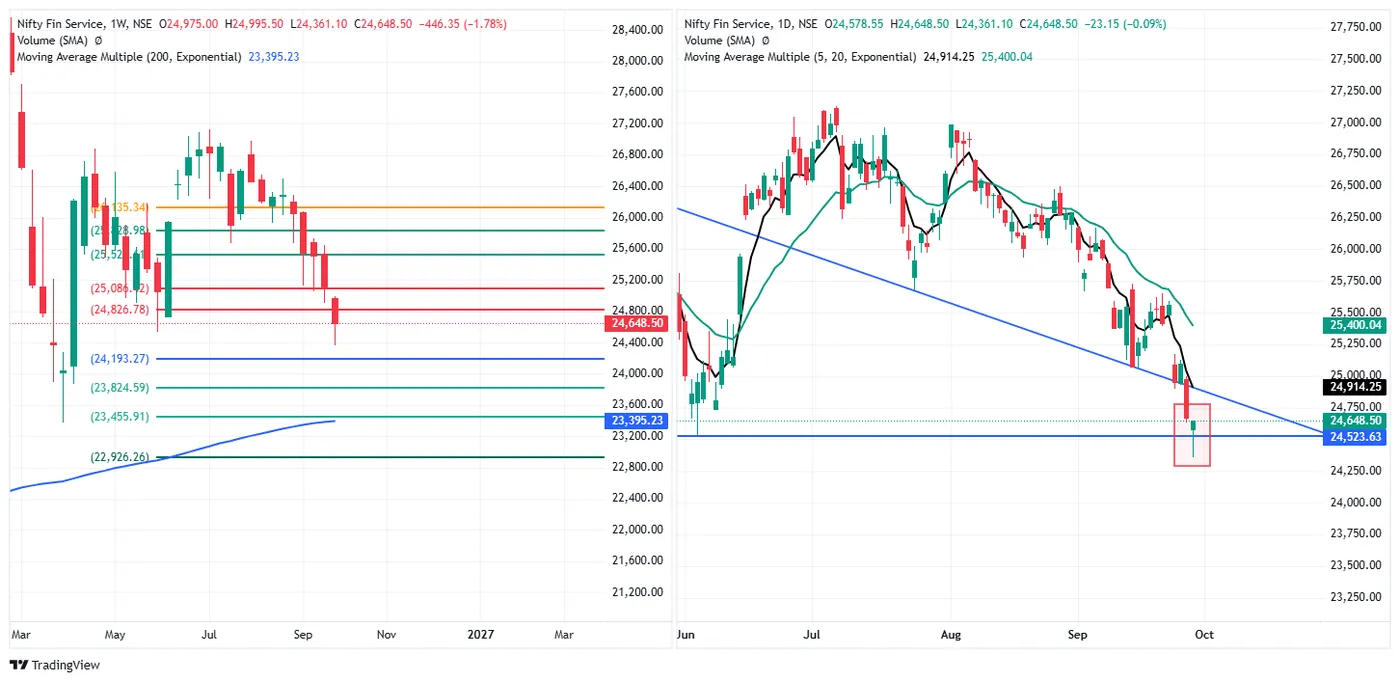
Close 24,648.50, down 23.15 (−0.09%), open 24,578.55, high 24,648.50, low 24,361.10.
Monday: 24,671.65, down 423.20 (−1.69%).
The close was the high of the day. It closed at the top of a 287.40-point range, 69.95 above its own open, the only equity index here to finish above where it started. The low had gone 162.53 below the marked 24,523.63; the close was 124.87 above it.
On the daily chart it is now below the descending trendline from June, which it broke on Monday.
265.75 below the 5-day (24,914.25), 751.54 below the 20-day (25,400.04), and 1,253.27 above the 200-week EMA (23,395.23) — 5.08% of price, from 6.82%.
The week is −1.78%, 45.3% up its range — the highest weekly position here.
Marked levels. Above 24,826.78 · 26,135.34. Below 24,523.63 · 24,193.27 · 23,824.59 · 23,455.91 · 22,926.26. Two marks near 25,100 and 25,500 are partly hidden and not quoted.
INDIA VIX — 29 September 2026
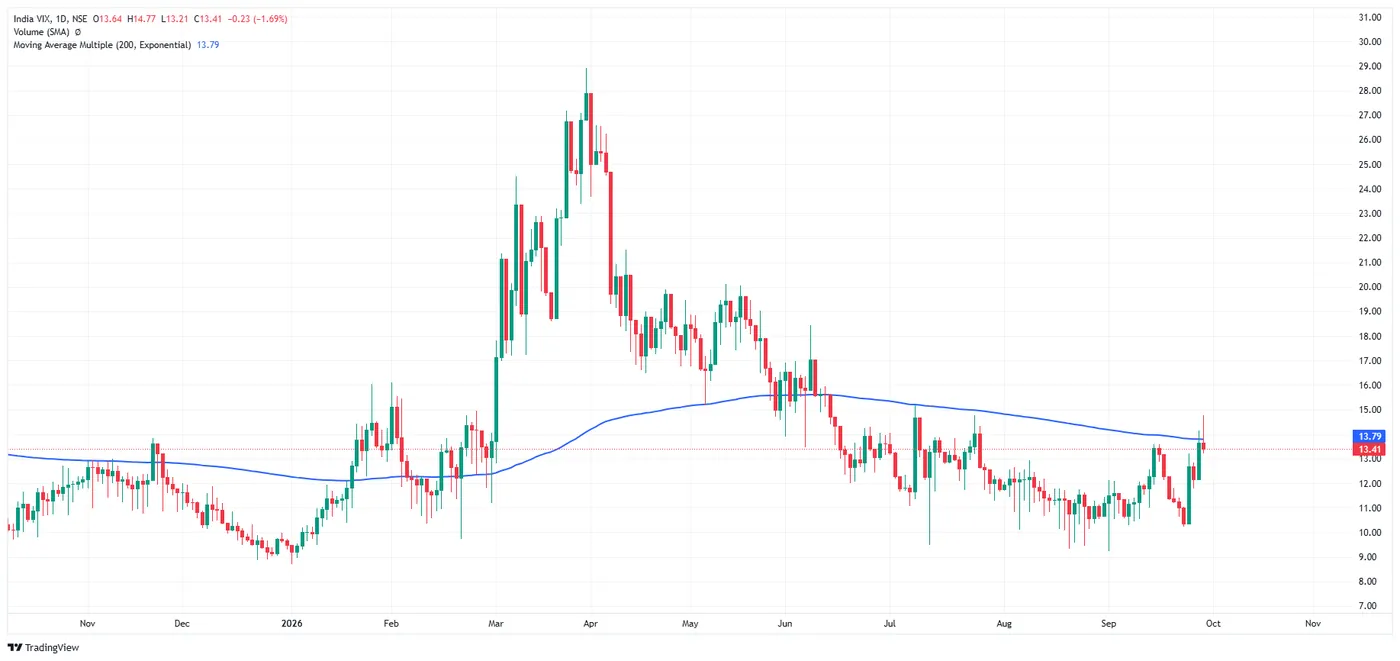
Close 13.41, down 0.23 (−1.69%), open 13.64, high 14.77, low 13.21.
It went above its 200-day EMA and closed back under it. The high of 14.77 was 0.98 above the average (13.79); the close was 0.38 below it, 2.83% of price. The 14.77 is the highest print this month and nearly a point above the average; the mid-September rise and last Thursday's 13.22 had both stopped short of it. Having got there, it closed 12.8% of the way up a 1.56-point range, near the low of the day. Read as a chart, the average acted as resistance on its first touch.
The open is Monday's close again — 13.64 — at least the fourth session this month to start exactly where the last one ended (Monday's own open was not captured). Monday itself rose 1.48 (+12.17%) from Friday's 12.16, so over the two sessions volatility is up 1.25, or 10.28%, while the Nifty fell 1.83%.
CRUDE OIL (MCX, 19 Oct fut) — 29 September 2026
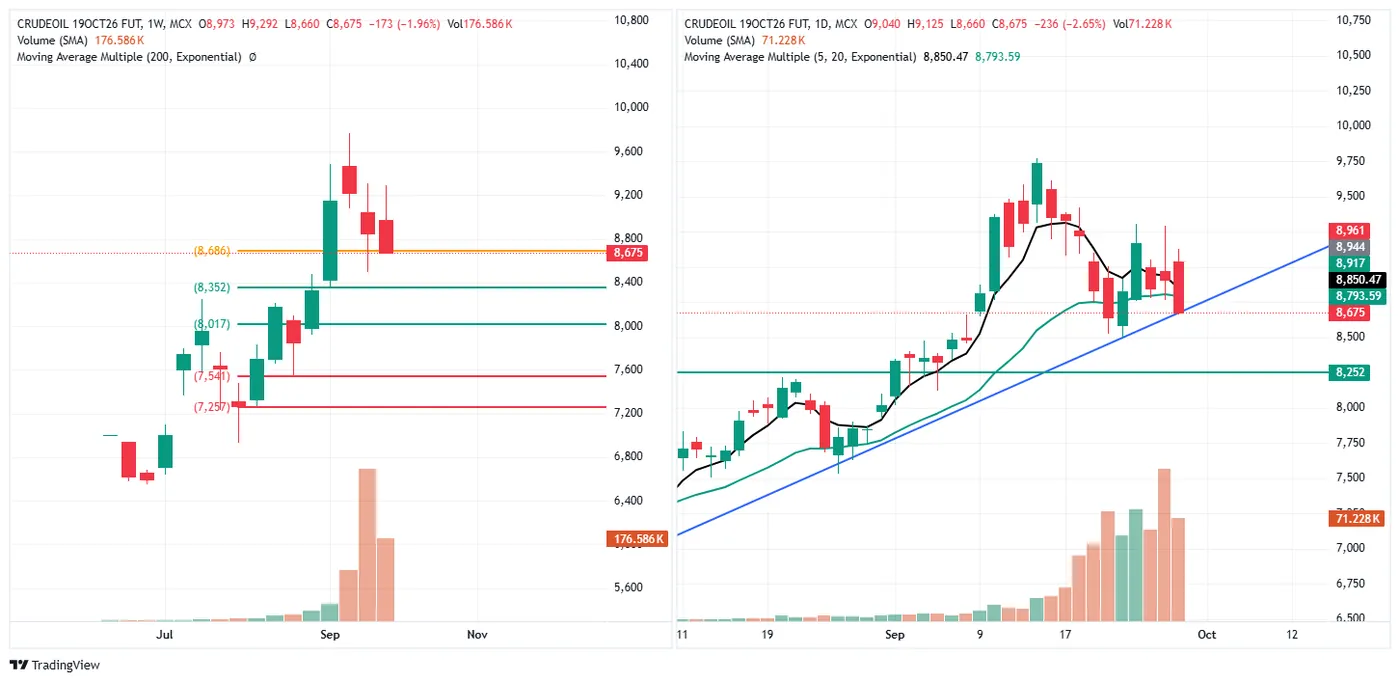
Close 8,675, down 236 (−2.65%), open 9,040, high 9,125, low 8,660. Volume 71.228K.
Monday was the one up day on this page: 8,911, up 63 (+0.71%). Tuesday opened 129 higher again and then fell 465 points top to bottom, closing 3.2% of the way up its range — 15 points off the low.
The 20-day cushion that Friday's note said one session could remove is gone. Price is 175.47 below the 5-day EMA (8,850.47) and 118.59 below the 20-day (8,793.59). It closed 11 below the marked 8,686 and on the rising trendline from August on the daily chart.
The week is −1.96%, and the close is 2.4% of the way up the weekly range — the bottom of it.
Marked levels. Above 8,686. Below 8,352 · 8,252 · 8,017 · 7,541 · 7,257.
GOLD (MCX, 4 Dec fut) — 29 September 2026
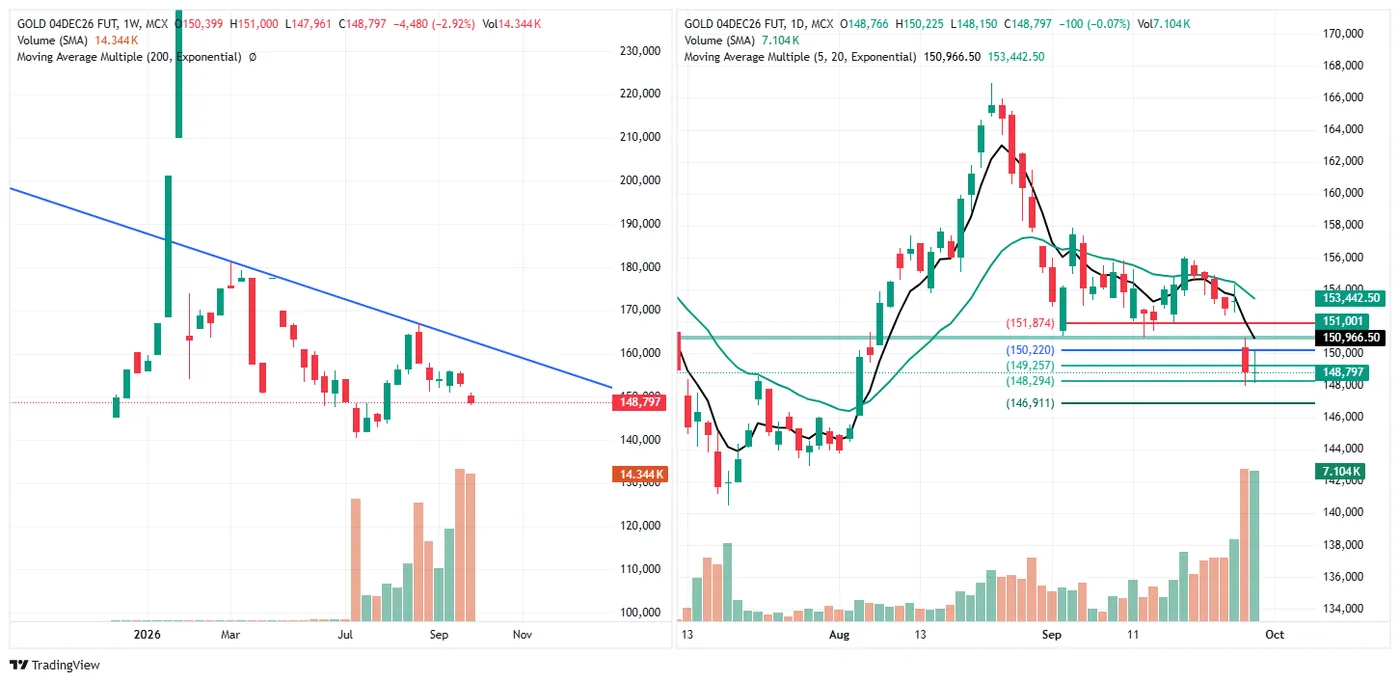
Close 148,797, down 100 (−0.07%), open 148,766, high 150,225, low 148,150. Volume 7.104K.
The contract has rolled. Friday's note used the October future; this is December, which trades at a premium. The two sets of levels are not comparable. On the December contract, the prior week closed at 153,277.
Monday did the damage. It opened 2,878 below Friday's close and finished at 148,897, down 4,380 (−2.86%). Monday's and Tuesday's volume bars are the two tallest on the daily chart. Monday's low of 147,961 was also the week's low, 333 under the marked 148,294. Tuesday was flat by comparison: a 2,075-point range, closing 31.2% up it and 503 above 148,294.
Below both averages: 2,169.50 under the 5-day (150,966.50) and 4,645.50 under the 20-day (153,442.50). On the weekly chart price remains below the descending trendline from the February high.
The week is −2.92%, 27.5% up its range.
Marked levels. Above 149,257 · 150,220 · 151,874. Below 148,294 · 146,911.
SILVER (MCX, 4 Dec fut) — 29 September 2026
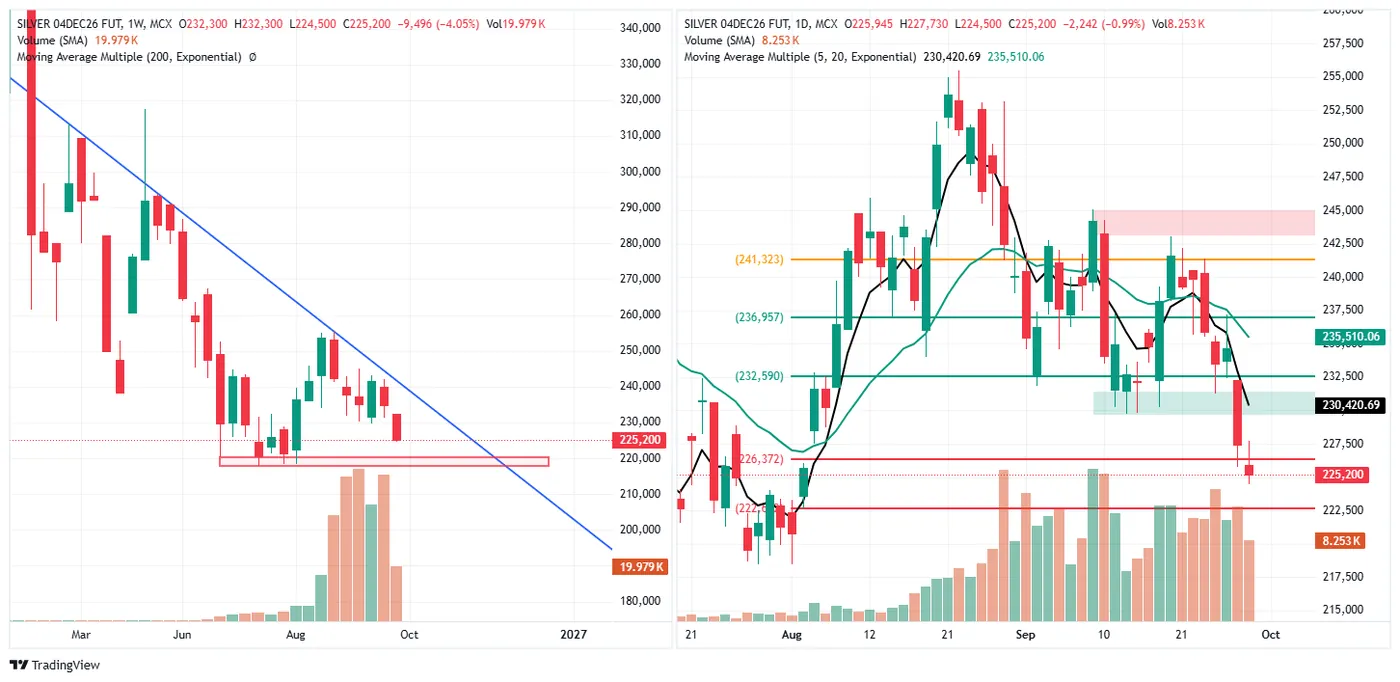
Close 225,200, down 2,242 (−0.99%), open 225,945, high 227,730, low 224,500. Volume 8.253K.
Monday: 227,442, down 7,254 (−3.09%), breaking down through the shaded band around 230,000–231,000 drawn from the mid-September lows.
Tuesday's close is 1,172 below the marked 226,372 and 3,080 above 222,120. It closed 21.7% of the way up a 3,230-point range and 745 below its own open.
Below both averages: 5,220.69 under the 5-day (230,420.69) and 10,310.06 under the 20-day (235,510.06). The weekly chart shows the next shaded support zone at roughly 218,000–220,000, made of the June–August lows (read off the chart).
The week is −4.05%, the worst on this page, and the close is 9.0% of the way up its weekly range.
Reconciling Friday: the week's change implies Friday closed at 234,696. The 25 September note quoted 235,000, which came from a chart taken before MCX's evening session ended. The difference is 304.
Marked levels. Above 226,372 · 232,590 · 236,957 · 241,323. Below 222,120.
Read across the session
| Tuesday | Closed in its range | Week so far | Up its weekly range | |
|---|---|---|---|---|
| Nifty Fin Service | −0.09% | 100.0% | −1.78% | 45.3% |
| Gold (Dec) | −0.07% | 31.2% | −2.92% | 27.5% |
| Nifty 50 | −0.28% | 79.8% | −1.83% | 28.7% |
| Sensex | −0.33% | 74.9% | −1.85% | 27.7% |
| Bank Nifty | −0.39% | 76.5% | −2.38% | 29.6% |
| Nifty Midcap Select | −0.74% | 23.9% | −2.52% | 11.1% |
| Silver (Dec) | −0.99% | 21.7% | −4.05% | 9.0% |
| India VIX | −1.69% | 12.8% | — | — |
| Crude oil (Oct) | −2.65% | 3.2% | −1.96% | 2.4% |
Monday was the fall; Tuesday was the test. Every equity index lost between 1.52% and 1.99% on Monday. On Tuesday the four large-cap indices all traded through a marked level intraday and closed back above it, finishing between 74.9% and 100% of their ranges. The midcap index is the exception: it closed on its mark and near its low.
The 200-week EMA, two sessions later
| Above its 200-week EMA, % of price | Friday | |
|---|---|---|
| Nifty Midcap Select | +16.59% (2,268.61) | +18.86% |
| Bank Nifty | +6.75% (3,663.33) | +9.03% |
| Nifty Fin Service | +5.08% (1,253.27) | +6.82% |
| Nifty 50 | +1.45% (329.13) | +3.27% |
| Sensex | −0.96% (−694.13) | +0.90% |
The Sensex has crossed the line; the Nifty is 1.45% from it. India VIX, the other average on this page, was touched from below and not held.
What the institutional flow did
| FII net | DII net | Net | DII cover | |
|---|---|---|---|---|
| 15 Sep | −₹2,977.86 Cr | +₹2,686.05 Cr | −₹291.81 Cr | 0.90× |
| 24 Sep | −₹5,027.36 Cr | +₹4,301.18 Cr | −₹726.18 Cr | 0.86× |
| 25 Sep | −₹3,693.93 Cr | +₹2,838.17 Cr | −₹855.76 Cr | 0.77× |
| 29 Sep | −₹9,980.22 Cr | +₹6,952.71 Cr | −₹3,027.51 Cr | 0.70× |
The largest foreign sale in this table by a wide margin — nearly double the 24th — and the lowest cover yet. Monday's figures are not shown: NSE's published endpoint gives only the latest session, and it was not captured on Monday.
Friday's note dropped the idea that a day's cover ratio predicts where that day closes. Tuesday is a second clean miss: the worst uncovered session of the month, and the large-cap indices closed in the top quarter of their ranges, with Fin Service at the high. What the table does show consistently is direction: foreign money has been a heavy net seller all month, and the size of that selling rose sharply on Tuesday.
The standing limits apply: these are net figures across all participants, a handful of sessions is not a rule, and flow published after the close cannot have caused the candles that produced it.
Descriptive commentary on price structure and marked levels. It is not advice, not a recommendation, and contains no targets or entry levels. NEOGreeks is not a SEBI-registered investment adviser.