NIFTY 50 — 25 September 2026
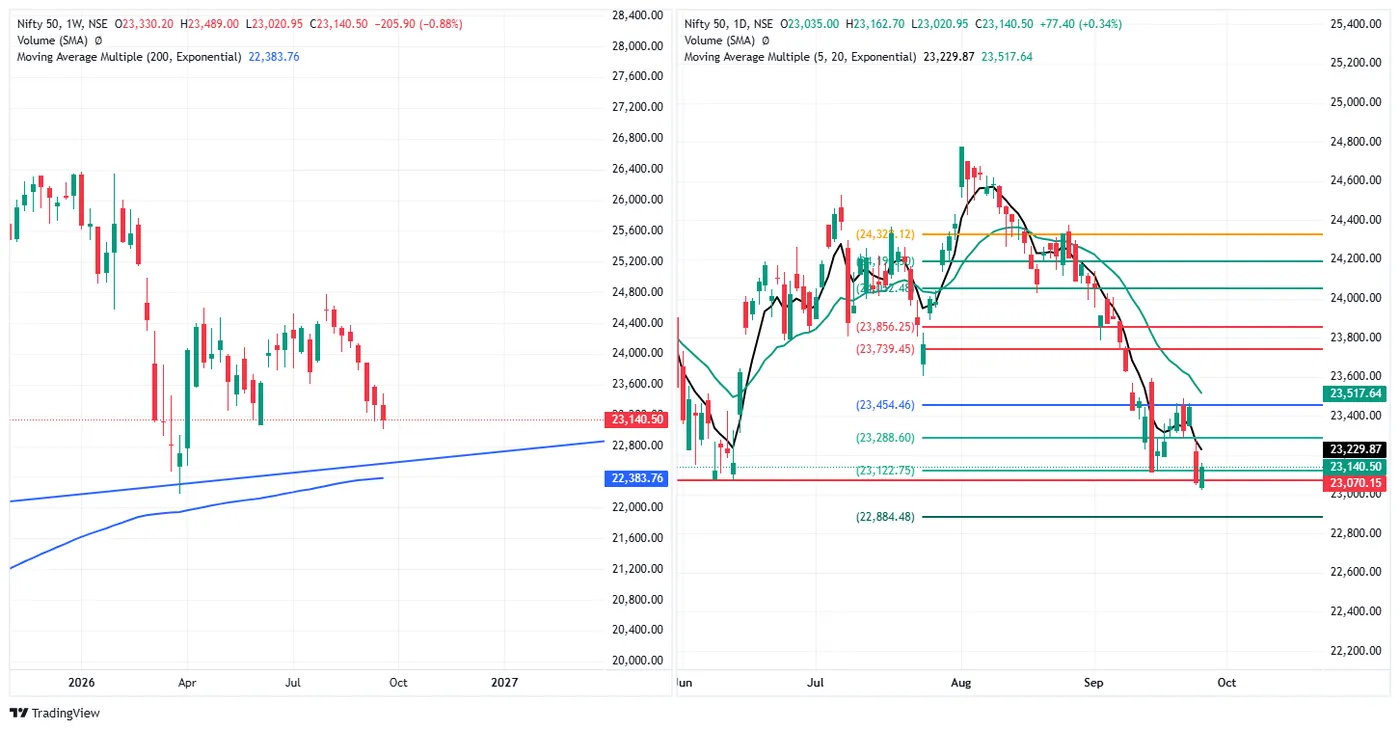
Close 23,140.50, up 77.40 (+0.34%), open 23,035.00, high 23,162.70, low 23,020.95.
A 141.75-point range, the narrowest day of the week, closed 84.3% of the way up it and 105.50 above its own open. It opened 28.10 below Thursday's close, made the week's low at 23,020.95 in the first part of the session, and spent the rest of the day above it.
Two levels reclaimed. Thursday closed 7.05 points under 23,070.15. Friday closed 70.35 above it, and 17.75 above 23,122.75 as well — the mark price had been beneath since the 24th. Neither is a wide margin, and the second is under two hundredths of a percent, so this is a reclaim in the bookkeeping sense rather than a decisive one.
The averages are the clearer structure, and they are split by timeframe. Price is below both short averages — 89.37 under the 5-day EMA (23,229.87) and 377.14 under the 20-day (23,517.64) — and 756.74 above the 200-week EMA (22,383.76), 3.27% clear of it. Short-term trend overhead, long-term trend still underneath. Nothing this month has gone near the 200.
The week closed −0.88%, at 25.5% of its own range, and Friday's low was the week's low.
Marked levels. Above 23,288.60 · 23,454.46 · 23,739.45 · 23,856.25. Below 23,122.75 · 23,070.15 · 22,884.48.
SENSEX — 25 September 2026
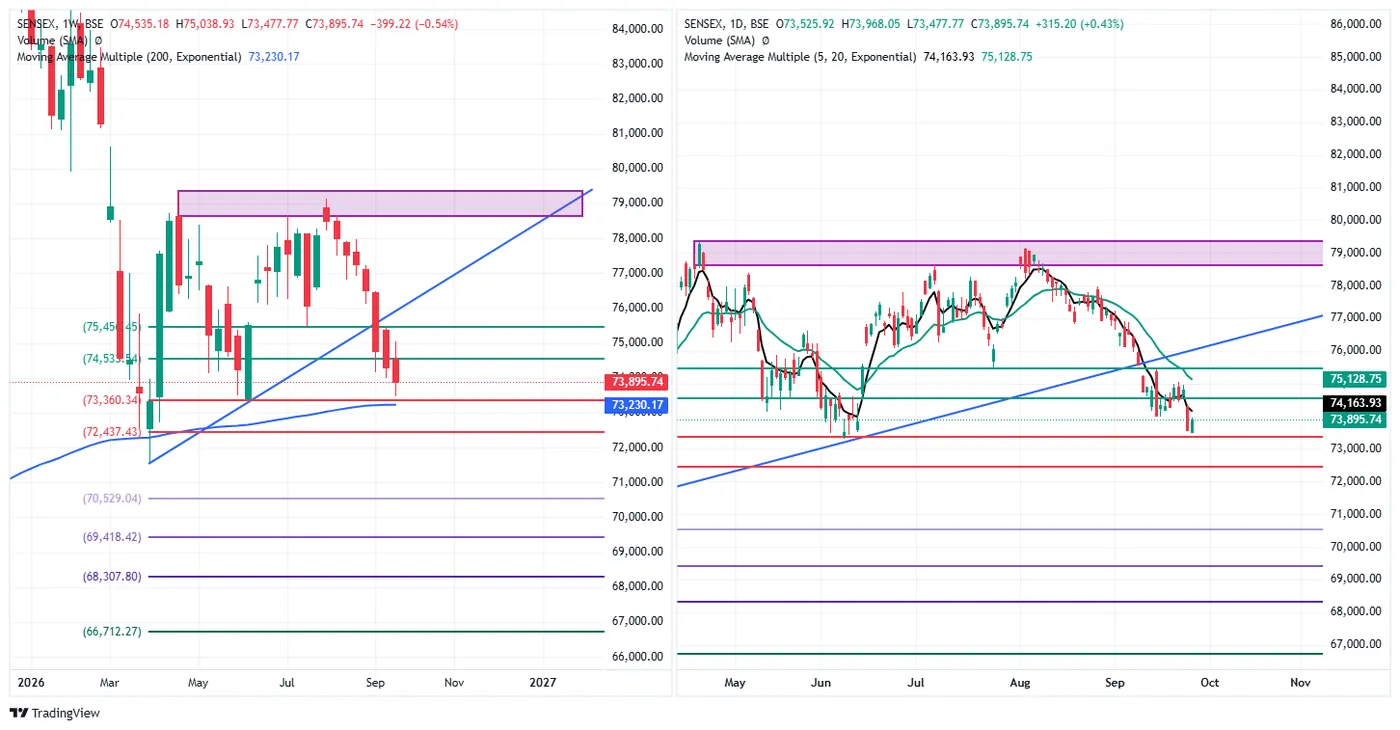
Close 73,895.74, up 315.20 (+0.43%), open 73,525.92, high 73,968.05, low 73,477.77.
Almost exactly the Nifty's session at a different scale: a 490.28-point range closed 85.3% of the way up it — within a point of the Nifty's 84.3% — and 369.82 above its own open, having opened 54.62 below Thursday's close and made the week's low intraday.
Same split in the averages. 268.19 below the 5-day EMA (74,163.93), 1,233.01 below the 20-day (75,128.75), and 665.57 above the 200-week EMA (73,230.17).
That last number is the one to hold on to. The Sensex is 0.90% above its 200-week, where the Nifty is 3.27% above its own. On the long-term average that both indices are measured against, the Sensex has roughly a quarter of the Nifty's cushion. It is the closer of the two to that line, which it last traded through in late March and April. (Corrected 29 September: this originally said the line "has not been tested this year", which was true of the Nifty but not the Sensex.)
The week closed −0.54%, at 26.8% of its range — the same position as the Nifty's 25.5%, so the two ended the week in step even though they spent the middle of it apart.
Marked levels. Above 74,535.54 · 75,456.45. Below 73,360.34 · 72,437.43 · 70,529.04 · 69,418.42 · 68,307.80 · 66,712.27.
BANK NIFTY — 25 September 2026
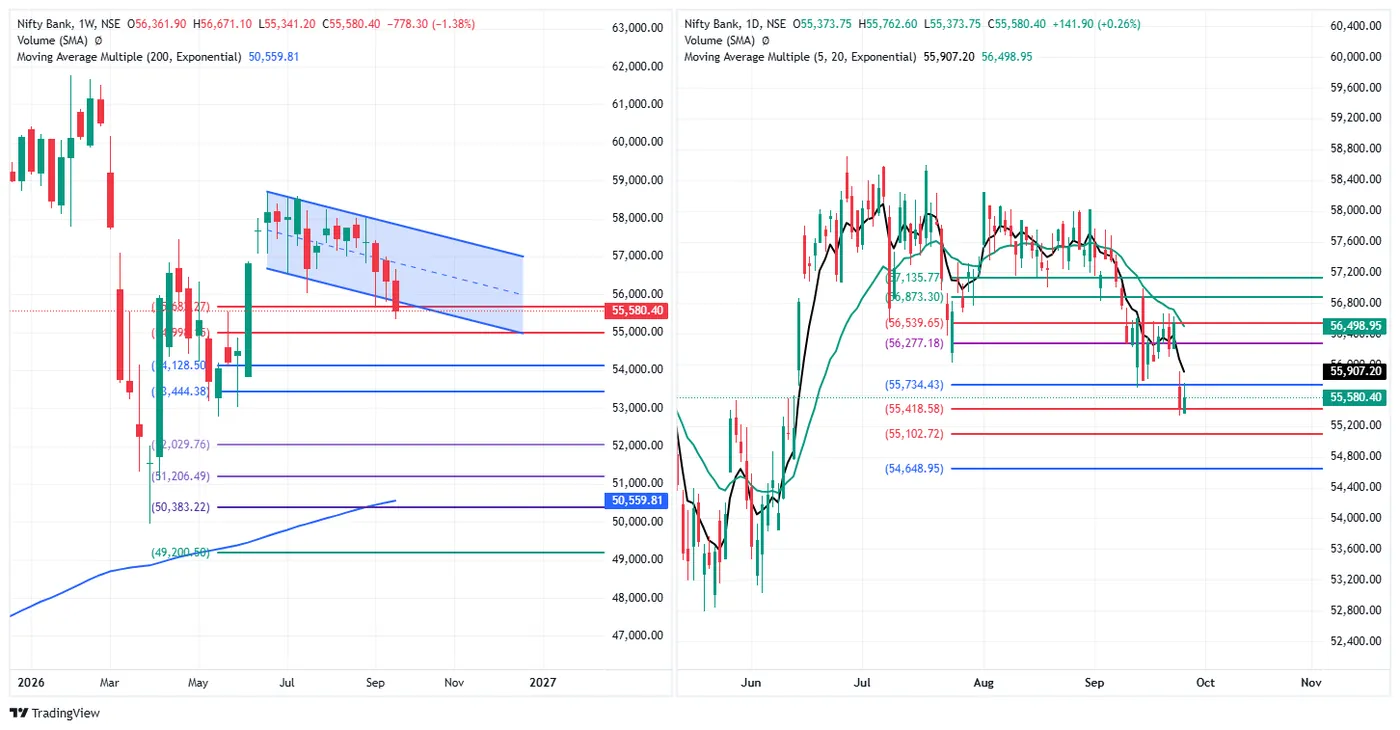
Close 55,580.40, up 141.90 (+0.26%), open 55,373.75, high 55,762.60, low 55,373.75.
The open and the low are the same number. Bank Nifty never traded below where it opened — the whole session was spent above the first print. It closed 206.65 above that open and 53.1% of the way up a 388.85-point range, which is the middle of its day rather than the top: the other two finished at 84% and 85% of theirs.
Its week low was Thursday, not Friday. The weekly low of 55,341.20 is the 24th's low, so while the Nifty and the Sensex were still making fresh lows on Friday morning, Bank Nifty had already stopped falling the day before — the same one-day lead it showed in the week to the 18th.
Where it sits. Almost exactly centred between two marks: 154.03 below 55,734.43 and 161.82 above 55,418.58, which is 51.2% of the way up a 315.85-point band. Nothing is being tested in either direction.
The averages, and the number that separates this index from the other two. Price is 326.80 below the 5-day EMA (55,907.20) and 918.55 below the 20-day (56,498.95) — the same short-term position as the Nifty and the Sensex. But it is 5,020.59 above its 200-week EMA (50,559.81), a cushion of 9.03%:
| Above its 200-week EMA | |
|---|---|
| Bank Nifty | +9.03% (5,020.59) |
| Nifty 50 | +3.27% (756.74) |
| Sensex | +0.90% (665.57) |
Ten times the Sensex's margin in percentage terms. Three indices that fell together this week are standing in very different places relative to the one average none of them has tested.
On the weekly chart the descending channel from July still contains price at its lower edge; the week closed −1.38%, the worst of the three, and at 18.0% of its weekly range against 25.5% and 26.8%.
Marked levels. Above 55,734.43 · 56,277.18 · 56,539.65 · 56,873.30 · 57,135.77. Below 55,418.58 · 55,102.72 · 54,648.95.
NIFTY MIDCAP SELECT — 25 September 2026
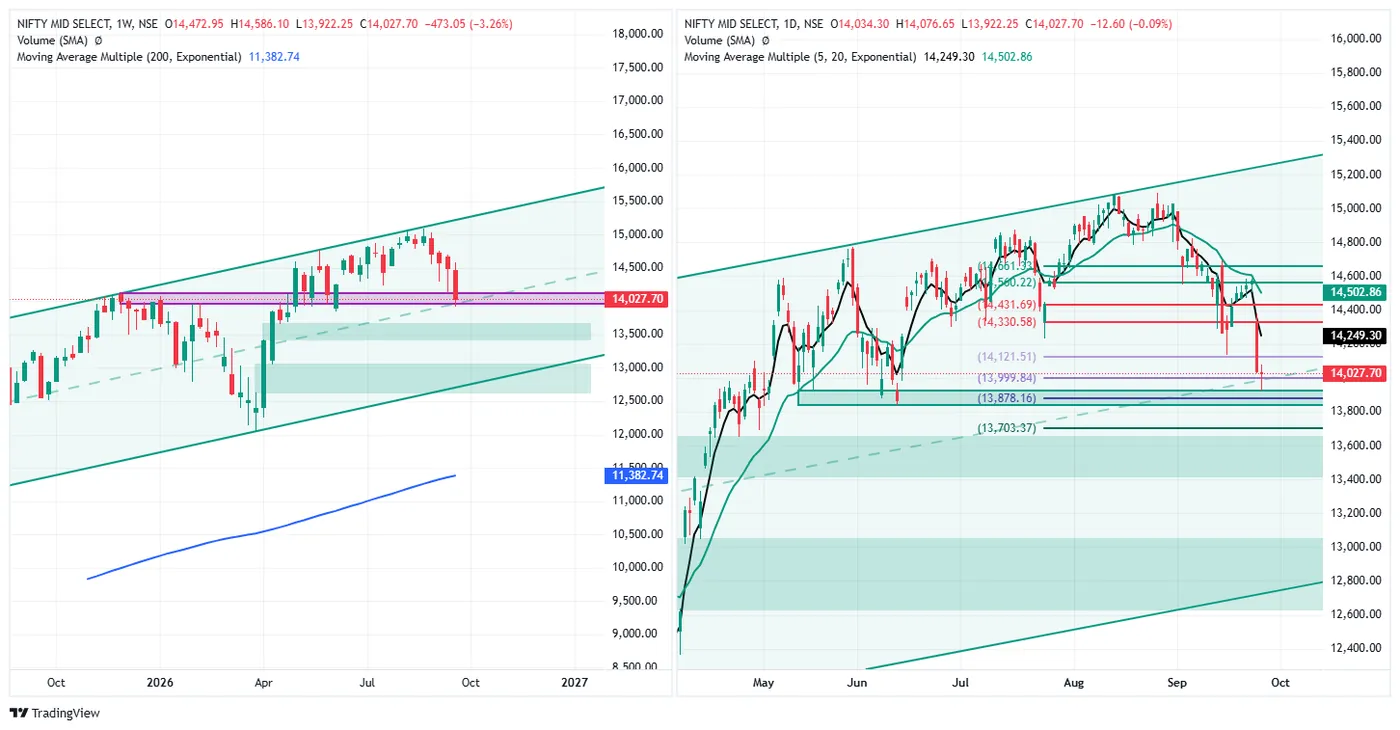
Close 14,027.70, down 12.60 (−0.09%) — effectively unchanged — open 14,034.30, high 14,076.65, low 13,922.25.
The only index that did not rise on Friday, and it finished 6.60 below its own open while still closing 68.3% of the way up a 154.40-point range. It made the week's low at 13,922.25 and recovered most of the day from there.
The week is −3.26%, by a wide margin the worst of the four, and it closed 15.9% of the way up its weekly range — the lowest of the four again. Two weeks running this index has been the one that falls furthest.
And it has the most room underneath. Price is 221.60 below the 5-day EMA (14,249.30) and 475.16 below the 20-day (14,502.86), the same short-term position as everything else — but 2,644.96 above its 200-week EMA (11,382.74), a cushion of 18.86%, the largest on this page by some way.
Marked levels. Above 14,121.51 · 14,330.58 · 14,431.69 · 14,560.22 · 14,661.31. Below 13,999.84 · 13,878.16 · 13,703.37.
NIFTY FIN SERVICE — 25 September 2026
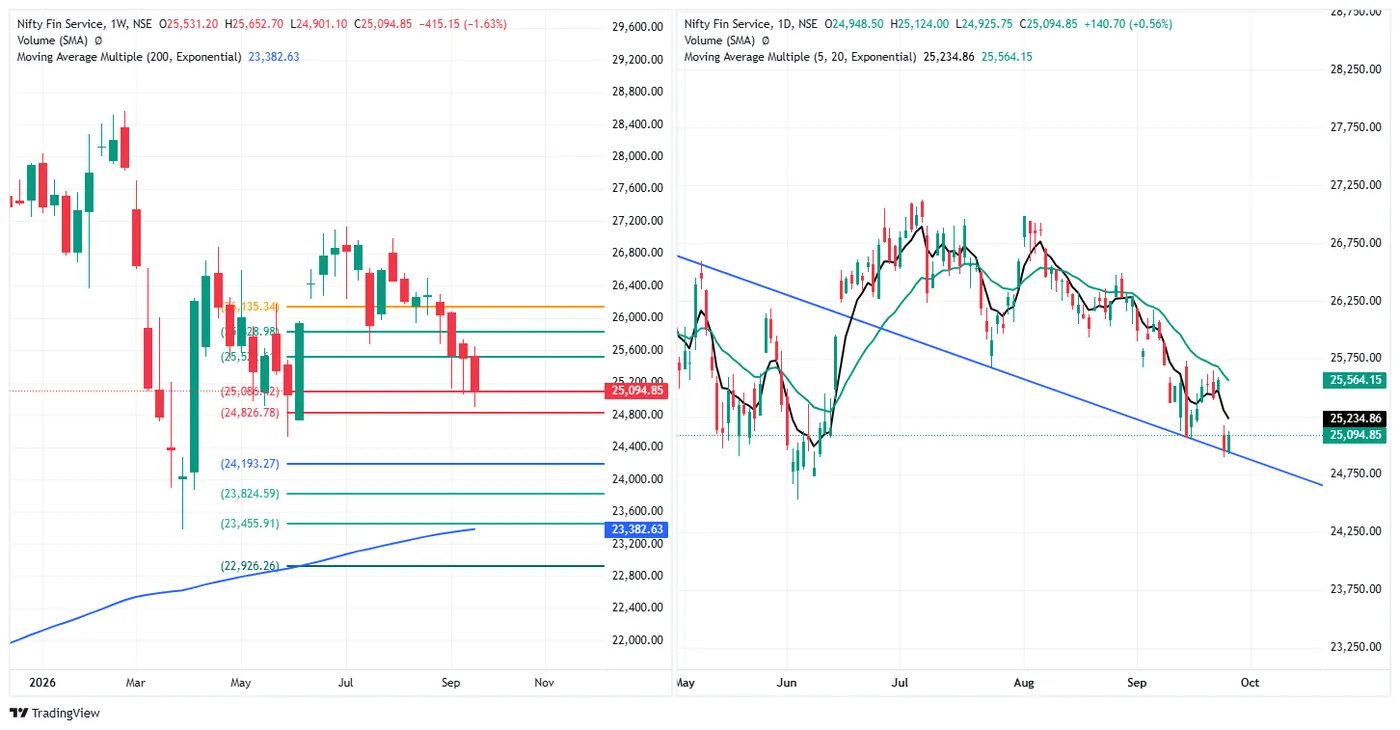
Close 25,094.85, up 140.70 (+0.56%) — the largest gain of the five — open 24,948.50, high 25,124.00, low 24,925.75.
A 198.25-point range closed 85.3% of the way up it, which is the same position as the Sensex's 85.3% to the decimal and the Nifty's 84.3%. On the week it is −1.63%, between the Bank Nifty's −1.38% and the midcap's −3.26%, and it closed 25.8% up its weekly range.
Its averages sit where everything else's do: 140.01 below the 5-day EMA (25,234.86), 469.30 below the 20-day (25,564.15), and 1,712.22 above the 200-week EMA (23,382.63) — 6.82%. That places it second in cushion terms, between the Bank Nifty's 9.03% and the Nifty's 3.27%, which is roughly where a financials index would be expected to sit relative to a banking one.
Marked levels. Above 25,628.98 · 26,135.34. Below 24,826.78 · 24,193.27 · 23,824.59 · 23,455.91 · 22,926.26. Two further marks sit within a few points of the close on either side but are partly obscured on this chart, so they are not quoted rather than guessed at.
INDIA VIX — 25 September 2026
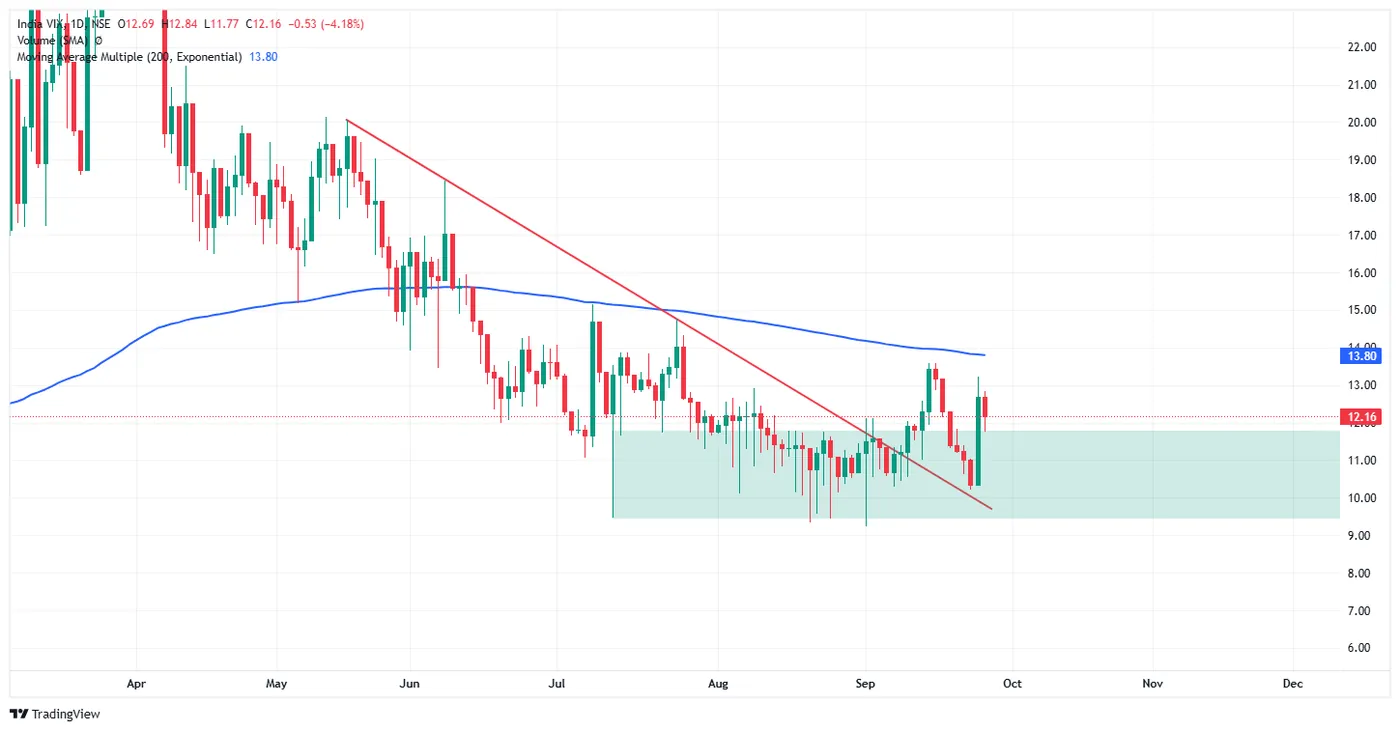
Close 12.16, down 0.53 (−4.18%), open 12.69, high 12.84, low 11.77.
The open is Thursday's close again — 12.69 — which is the third time this month volatility has started a session exactly where the last one ended. It gave back about a fifth of Thursday's 22.61% spike and closed 36.4% of the way up a 1.07-point range.
It is below its 200-day EMA at 13.80, by 1.64 points or 13.5%. Thursday's high of 13.22 did not reach that average either. So the spike that looked violent on the day has not carried volatility back above its own long-term mean — it went from unusually low to ordinary, not to elevated.
Marked levels. Above 14.68 · 23.65 · 27.17 · 28.91. Below 10.10.
CRUDE OIL (MCX, 19 Oct fut) — 25 September 2026
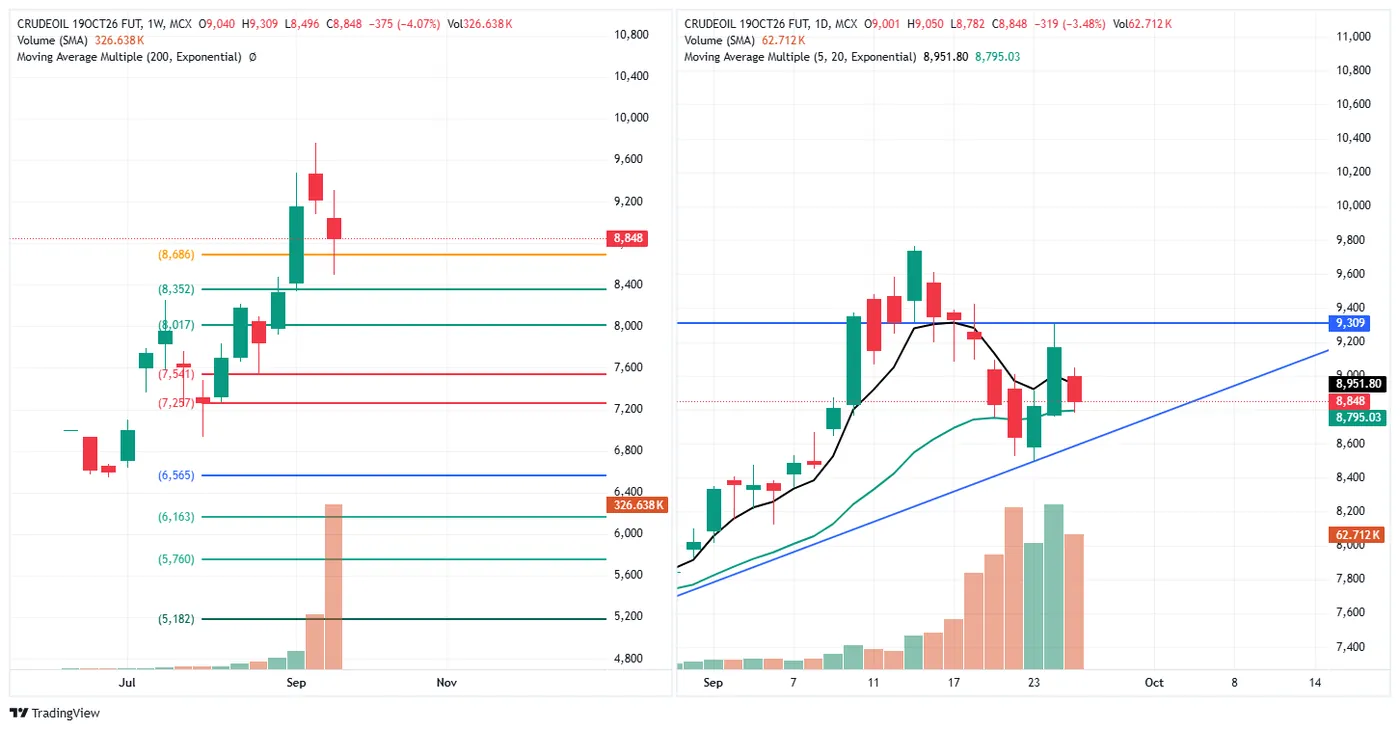
Close 8,848, down 319 (−3.48%), open 9,001, high 9,050, low 8,782. Volume 62.712K.
Thursday's 3.82% surge has been more than given back. Price closed 153 below its own open and 24.6% of the way up a 268-point range — the bottom third, where on Thursday it had been trading at the very top of its day.
On the week it is −4.07%, having been positive on Thursday evening. The week's range of 813 points is the widest this contract has shown, and the close sits 43.3% up it.
The two daily averages have split around price — 103.80 below the 5-day (8,951.80) and 52.97 above the 20-day (8,795.03). That 52.97 is the whole of the remaining cushion: a single session of this size takes it out.
Marked levels. Above 8,686 is now below price by 162. Then 8,352 · 8,017 · 7,541 · 7,257 · 6,565 · 6,163 · 5,760 · 5,182.
GOLD (MCX, 5 Oct fut) — 25 September 2026
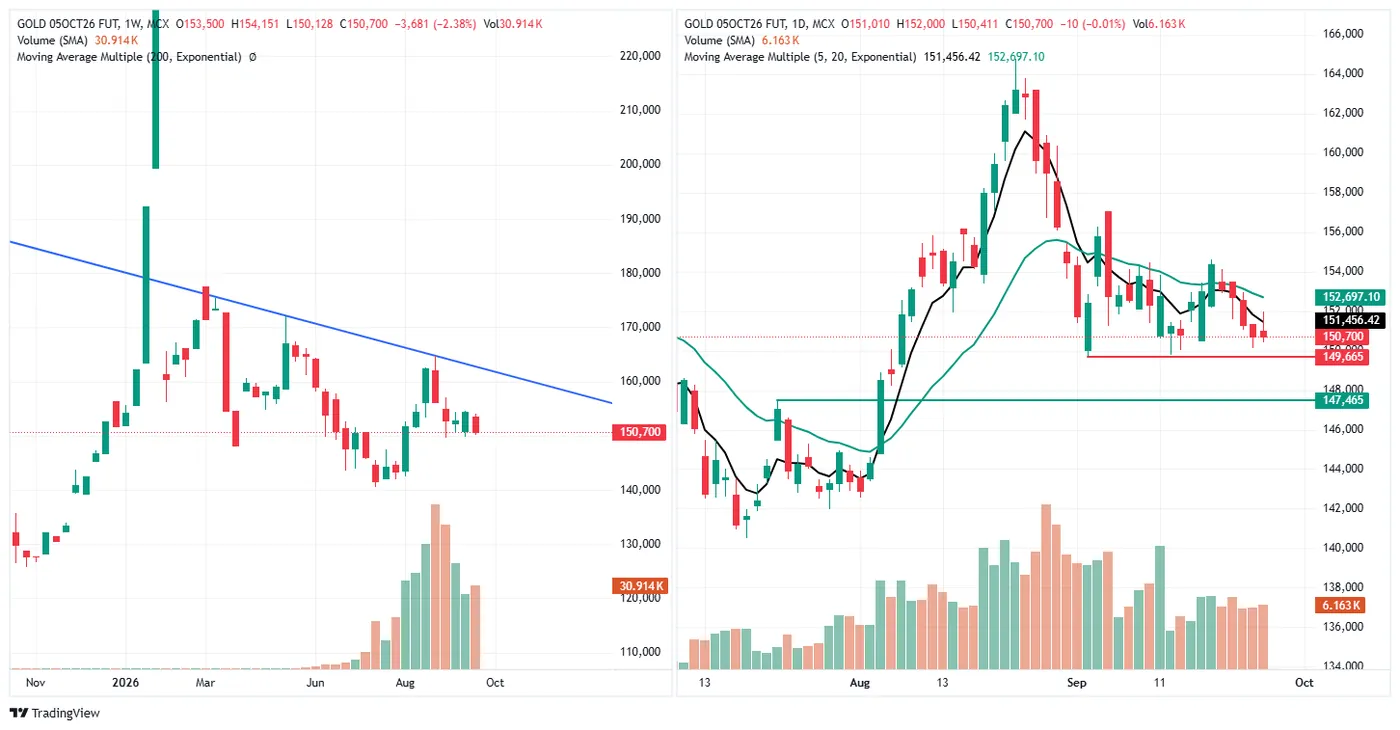
Close 150,700, down 10 (−0.01%) — flat to a hundredth of a percent — open 151,010, high 152,000, low 150,411.
A 1,589-point range that ended ten points from where it started the day before, closing 310 below its own open and 18.2% of the way up that range.
The week is −2.38%, and the close is 14.2% of the way up its weekly range. Gold has now fallen in each of the last three sessions covered here — 154,263 on the 18th, 153,069 on the 21st, 150,453 on the 24th, 150,700 now — and while Friday itself was flat, it is flat at the bottom of the move rather than after one.
Below both averages: 756.42 under the 5-day (151,456.42) and 1,997.10 under the 20-day (152,697.10).
Where it sits. The marked 149,665 is 1,035 below (0.69%) and 147,465 is 3,235 below (2.15%). The 150,672 that broke on the 24th is now 28 points under price — close enough that it is neither reclaimed nor decisively lost.
Marked levels. Above 150,672 · 153,365 · 156,057. Below 149,665 · 147,465.
SILVER (MCX, 4 Dec fut) — 25 September 2026
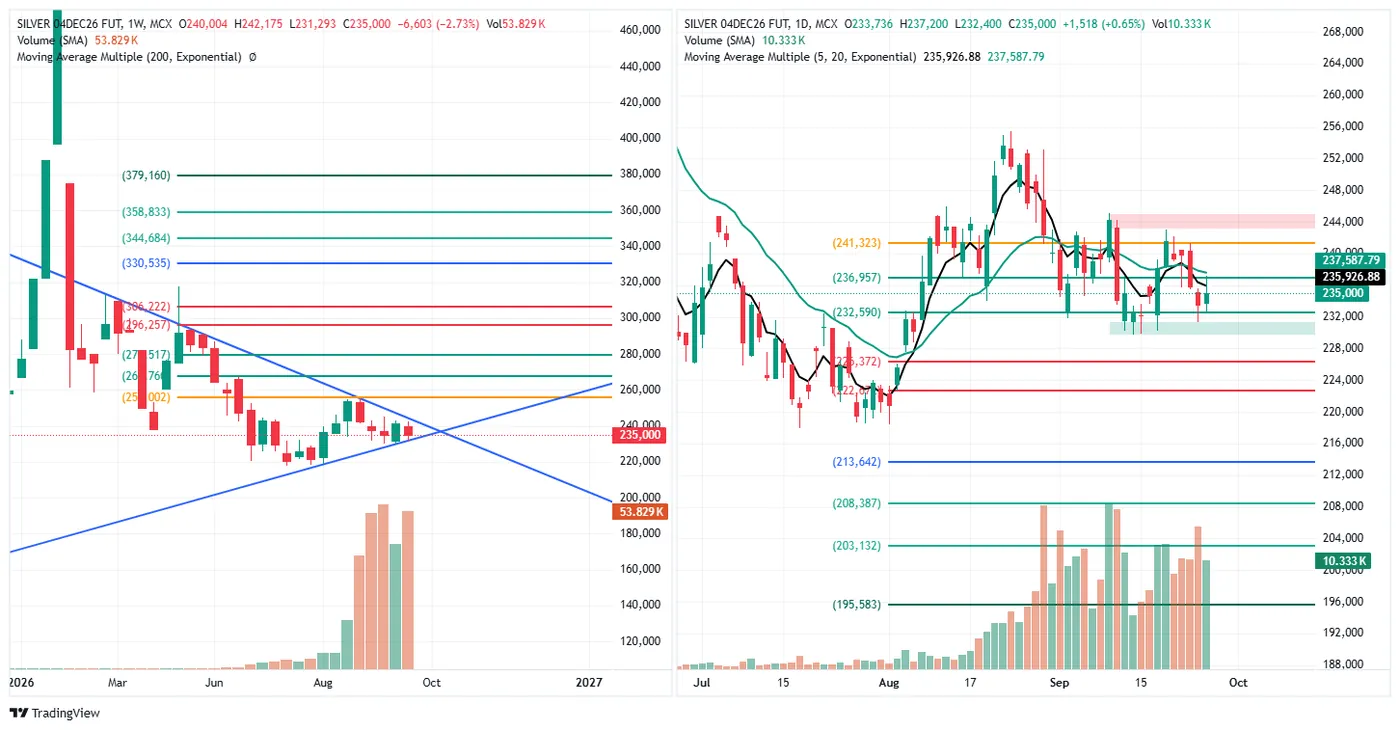
Close 235,000, up 1,518 (+0.65%), open 233,736, high 237,200, low 232,400. Volume 10.333K.
It rose on Friday, closing 54.2% of the way up a 4,800-point range and 1,264 above its own open — a steadier session than the day before.
The week is −2.73%, and the prior week's close of 241,603 is exactly the figure derived from Thursday's chart, so the two weeks reconcile. The close is 34.1% of the way up its weekly range, which is the middle of it, and a better position than gold's 14.2%.
Still below both daily averages: 926.88 under the 5-day (235,926.88) and 2,587.79 under the 20-day (237,587.79). The two averages are only 1,660.91 apart — 0.71% of price — so they have converged around it much as gold's weekly pair did last week.
Where it sits. Between the marked 236,957 just above and 232,590 below, inside the band it has held since early September. Below those, 226,372 and 222,120 are the next marks, then a wide gap to 213,642.
Marked levels. Above 236,957 · 241,323. Below 232,590 · 226,372 · 222,120 · 213,642 · 208,387 · 203,132 · 195,583.
Read across the session
| Day | Closed in its range | Week | Up its weekly range | |
|---|---|---|---|---|
| Nifty Fin Service | +0.56% | 85.3% | −1.63% | 25.8% |
| Sensex | +0.43% | 85.3% | −0.54% | 26.8% |
| Nifty 50 | +0.34% | 84.3% | −0.88% | 25.5% |
| Bank Nifty | +0.26% | 53.1% | −1.38% | 18.0% |
| Silver (Dec) | +0.65% | 54.2% | −2.73% | 34.1% |
| Gold (Oct) | −0.01% | 18.2% | −2.38% | 14.2% |
| Nifty Midcap Select | −0.09% | 68.3% | −3.26% | 15.9% |
| India VIX | −4.18% | 36.4% | — | — |
| Crude oil (Oct) | −3.48% | 24.6% | −4.07% | 43.3% |
Three of the four equity indices closed between 84% and 86% of the way up their ranges — Fin Service, the Sensex and the Nifty are within a percentage point of each other. Bank Nifty and the midcap did not join them, and the two things that actually fell hard were crude and volatility.
The 200-week EMA is the line worth watching
Every index on this page sits below its 5- and 20-day EMAs and above its 200-week. The shape is identical across all five. The distance is not:
| Above its 200-week EMA | ||
|---|---|---|
| Nifty Midcap Select | +18.86% | 2,644.96 |
| Bank Nifty | +9.03% | 5,020.59 |
| Nifty Fin Service | +6.82% | 1,712.22 |
| Nifty 50 | +3.27% | 756.74 |
| Sensex | +0.90% | 665.57 |
Twenty-one to one between the extremes — 18.86% against 0.90%.
The two ends line up against the week exactly backwards: the midcap index fell furthest (−3.26%) and has the most room beneath it, while the Sensex fell least (−0.54%) and has the least. The middle three do not order cleanly — ranked by the week it is Fin Service then Bank Nifty; ranked by cushion it is Bank Nifty then Fin Service — so this is a pattern at the extremes and not a rank correlation. Said that way because the tidier version would have been wrong.
India VIX is the exception to the whole picture — it is below its 200-day EMA, by 13.5%, and Thursday's spike did not reach it.
One ordering note worth keeping: Bank Nifty's week low was made on Thursday while the Nifty and the Sensex made theirs on Friday morning. It stopped falling a day earlier, exactly as it did in the week to the 18th.
What the institutional flow did — and the pattern that just broke
| FII net | DII net | Net | DII cover | |
|---|---|---|---|---|
| 15 Sep | −₹2,977.86 Cr | +₹2,686.05 Cr | −₹291.81 Cr | 0.90× |
| 24 Sep | −₹5,027.36 Cr | +₹4,301.18 Cr | −₹726.18 Cr | 0.86× |
| 25 Sep | −₹3,693.93 Cr | +₹2,838.17 Cr | −₹855.76 Cr | 0.77× |
This note has been tracking a relationship for two weeks, and on Friday it failed.
The observation was that on the only two September sessions where domestic buying did not cover foreign selling — the 15th at 0.90× and the 24th at 0.86× — every index closed on or within a few percent of its low, while every covered session closed off the lows. It was stated each time with the caveat that two observations are not a rule.
Friday is the third uncovered session, at the lowest cover ratio of the three (0.77×) and the largest negative net (−₹855.76 Cr) — and both indices closed at the top of their ranges, 84.3% and 85.3%. On the reading that had held twice, this was the strongest signal yet for a weak close, and the market did the opposite.
So the relationship is not a rule, and this page should stop presenting it as one. What survives is narrower and worth keeping: the direction of the month's flow is unambiguous — FII have sold on 9 of the last 11 sessions — but a single day's cover ratio does not tell you where that day will close. Two matches and one clean miss is a coincidence rate, not a mechanism.
The limits stated with it each time are the reason the miss is reportable rather than embarrassing: these are net figures across all participants, a handful of observations is not a rule, and flow published after the close cannot have caused the candles that produced it.
Descriptive commentary on price structure and marked levels. It is not advice, not a recommendation, and contains no targets or entry levels. NEOGreeks is not a SEBI-registered investment adviser.