NIFTY 50 — 24 September 2026
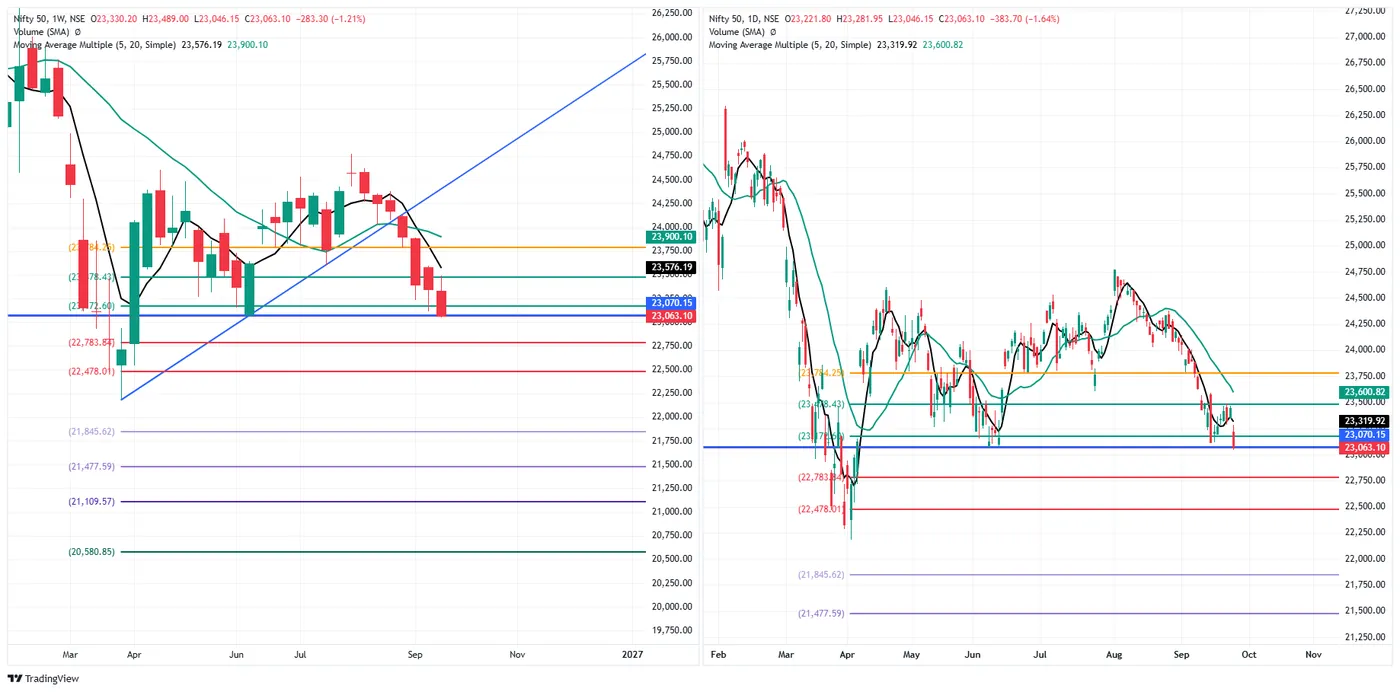
Close 23,063.10, down 383.70 (−1.64%), open 23,221.80, high 23,281.95, low 23,046.15.
It gapped down 225 points at the open, never traded back to Wednesday's close, and finished 158.70 below its own open and 7.2% of the way up a 235.80-point range — close to the bottom of a day it spent entirely below where it started.
The recovery has failed, and failed below where it began. Four consecutive higher closes ran from the 16th to the 21st. Today undoes all of them at once:
| Close | |
|---|---|
| 16 Sep | 23,217.60 |
| 17 Sep | 23,270.60 |
| 18 Sep | 23,346.40 |
| 21 Sep | 23,414.30 |
| 23 Sep | 23,446.80 |
| 24 Sep | 23,063.10 |
The low the bounce started from was 23,116.10 on the 16th. Today's low of 23,046.15 is 69.95 below it and the close of 23,063.10 is 53.00 below it as well. This is not a pullback inside the recovery — the index has traded and closed under the floor the recovery was built on.
It is now beneath every average on the chart. The 5-day at 23,319.92 is 256.82 above, the 20-day at 23,600.82 is 537.72 above, and on the weekly the 5-period at 23,576.19 and 20-period at 23,900.10 are 513.09 and 837.00 above. Both timeframes, both speeds, all four overhead. Last week crude was the instrument in that position on its daily chart alone while its weekly held; here there is no timeframe still holding.
Where it sits. The close is 7.05 points below 23,070.15 — effectively on that line, from underneath. Below it the next marks are 22,783.84 (279.26, 1.21%) and 22,478.01 (585.09, 2.54%). Above, 23,478.43 is 415.33 away (1.80%) and 23,784.25 is 721.15 (3.13%).
The week is −1.21% with one session still to run.
Marked levels. Above 23,070.15 · 23,478.43 · 23,784.25. Below 22,783.84 · 22,478.01 · 21,845.62 · 21,477.59 · 21,109.57 · 20,580.85.
SENSEX — 24 September 2026
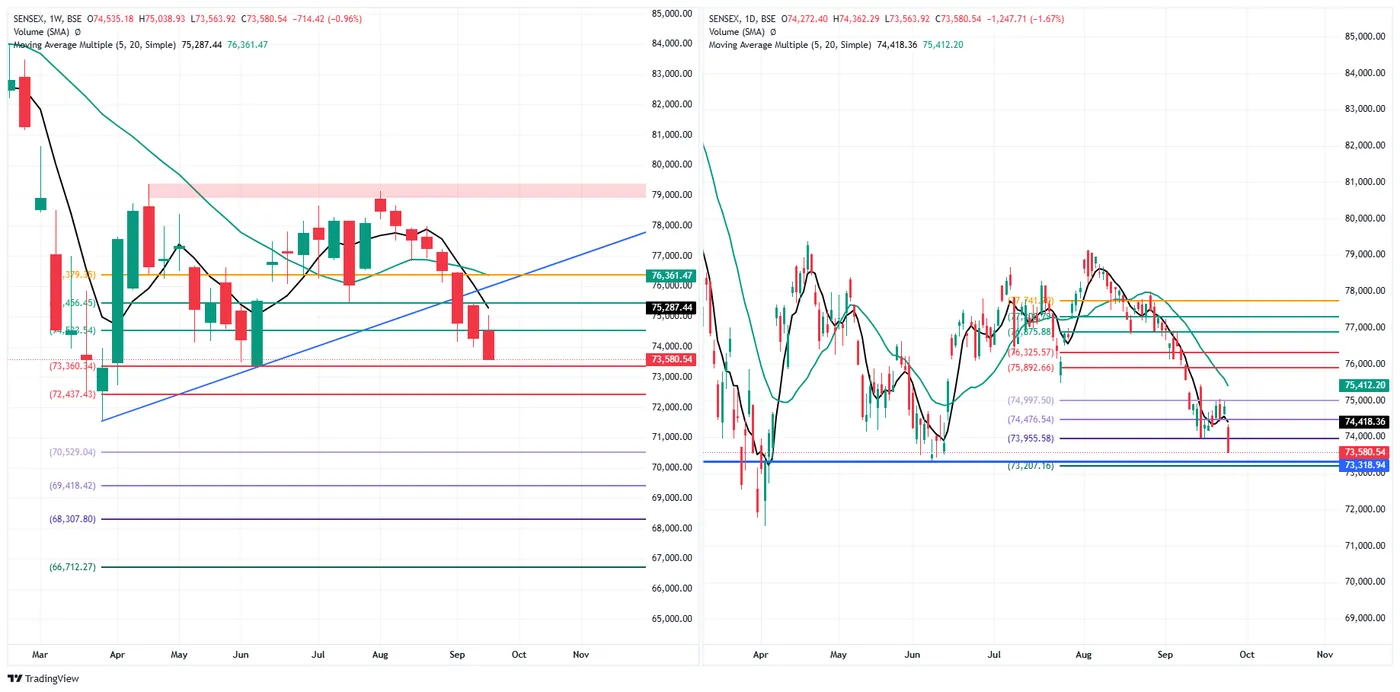
Close 73,580.54, down 1,247.71 (−1.67%), open 74,272.40, high 74,362.29, low 73,563.92.
Gapped down 555.85 and closed 2.1% of the way up a 798.37-point range — 16.62 points off its low, and 691.86 below its own open. The last time both large caps finished this close to the bottom of their day was 15 September, when each closed exactly on its low.
Both of this index's levels have reversed in one session.
| 73,955.58 | held on the 16th, low stopping 25.75 above it, and held all last week | today −375.04 — broken |
| 74,476.54 | reclaimed on the 21st at +382.45, after four sessions of failing at it | today −896.00 — lost again |
Monday's note called the reclaim of 74,476.54 "the first thing this index has resolved in a week". Three sessions later it is unresolved, and the floor underneath it has gone too.
Below every average, like the Nifty. 5-day 74,418.36 (837.82 above), 20-day 75,412.20 (1,831.66), weekly 5-period 75,287.44 (1,706.90), weekly 20-period 76,361.47 (2,780.93).
Where it sits. In the gap beneath 73,955.58 and above a cluster — 73,360.34 is 220.20 below (0.30%), 73,318.94 is 261.60 (0.36%), 73,207.16 is 373.38 (0.51%). Three marked levels inside 0.51% of each other sit directly under price, which is a denser floor than the Nifty has beneath it.
The week is −0.96%, and the week's low is today's low.
Marked levels. Above 73,955.58 · 74,476.54 · 74,997.50 · 75,892.66 · 76,325.57 · 76,875.88. Below 73,360.34 · 73,318.94 · 73,207.16 · 72,437.43.
NIFTY MIDCAP SELECT — 24 September 2026
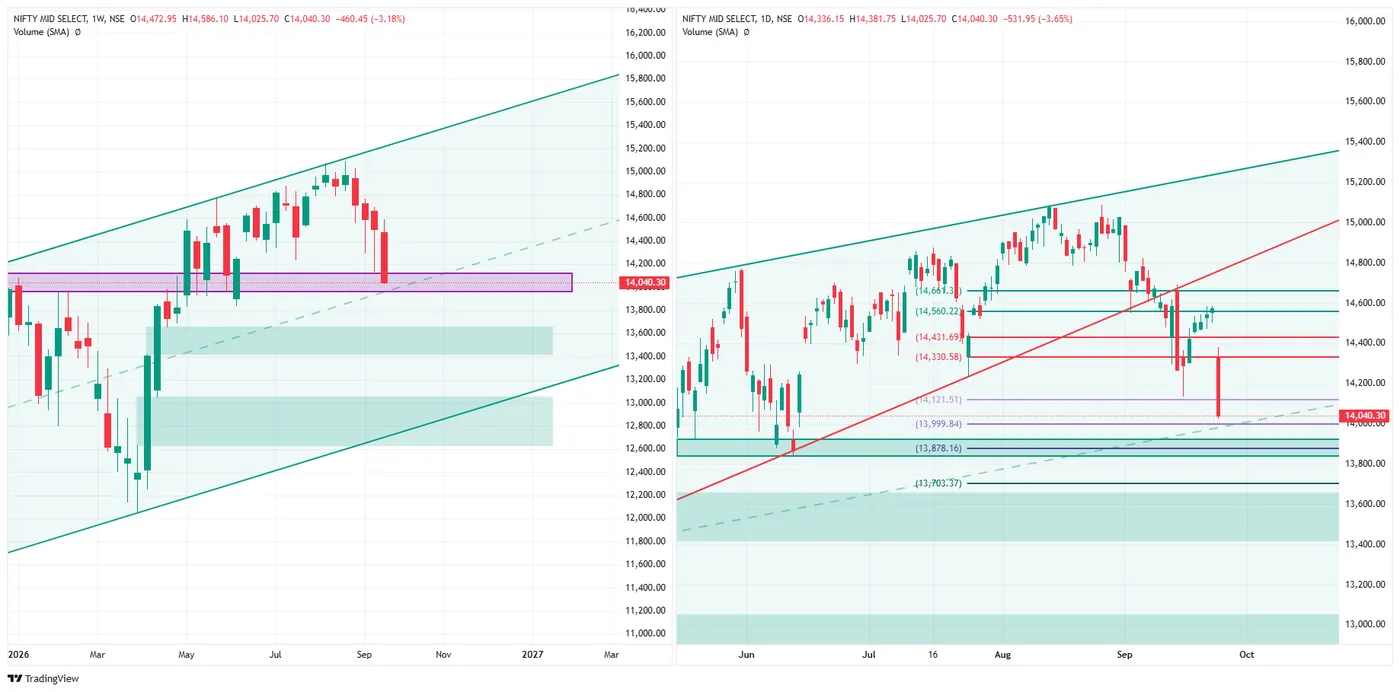
Close 14,040.30, down 531.95 (−3.65%), open 14,336.15, high 14,381.75, low 14,025.70.
It fell more than twice as far as either large cap — 2.23 times the Nifty's 1.64% and 2.19 times the Sensex's 1.67% — gapped down 236.10 at the open, closed 295.85 below that open, and finished 4.1% of the way up a 356-point range.
Three sessions ago this index moved +0.02% and was the smallest mover of the four. That is the character of it: it does nothing for two sessions and then does everything in one. The same pattern produced −2.18% on the 15th while the large caps fell about 1%, and +2.60% off the weekly low a week later.
14,121.51 has broken. That is the level whose hold was the quiet good news of the 16th, when the low of 14,133.30 stopped 11.79 points above it. Today the close is 81.21 below it.
Where it sits. In a 121.67-point gap between 14,121.51 just above and 13,999.84 just below — 40.46 away, 0.29% — and 33.3% of the way up it. The round number and the marked level are effectively the same place, and price is sitting on top of both. Beneath those, 13,878.16 is 162.14 (1.15%) and 13,703.37 is 336.93 (2.40%).
On the weekly chart the rising channel that has held all year is still intact and price remains inside it, but it has fallen out of the upper half and back into the band it spent the spring consolidating in.
The week is −3.18%, against −1.21% for the Nifty and −0.96% for the Sensex — more than three times the Sensex's fall with one session still to run.
Marked levels. Above 14,121.51 · 14,330.58 · 14,431.69 · 14,560.22 · 14,661.31. Below 13,999.84 · 13,878.16 · 13,703.37.
BANK NIFTY — 24 September 2026
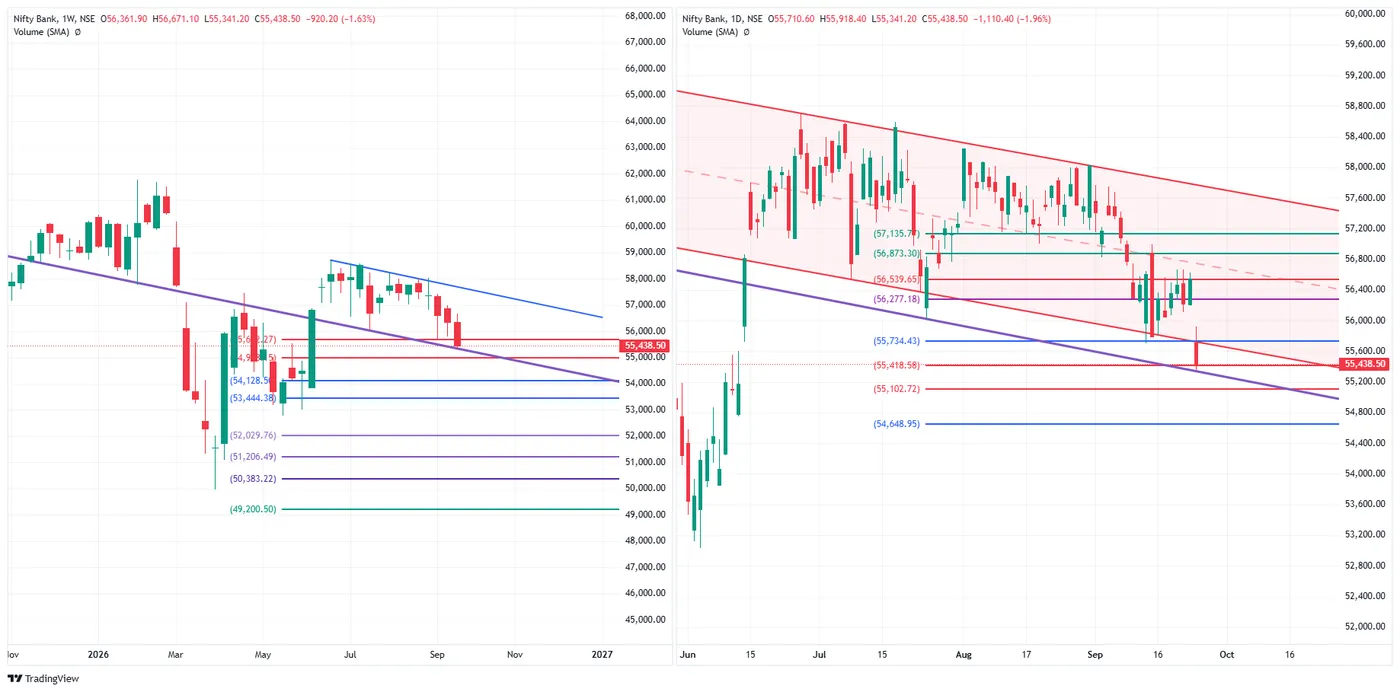
Close 55,438.50, down 1,110.40 (−1.96%), open 55,710.60, high 55,918.40, low 55,341.20.
It gapped down 838.30 — by far the largest opening gap of the four, against 555.85 for the Sensex, 236.10 for the midcap and 225.00 for the Nifty — and never recovered any of it. The close is 272.10 below the open and 16.9% of the way up a 577-point range, which is the highest close-in-range of the four and the only thing about this session that reads better than its neighbours.
Two levels gone in one day.
| 56,277.18 | reclaimed on the 18th by 15.27, held through Monday | today −838.68 |
| 55,734.43 | held on the 16th, the low staying 77.77 above it | today −295.93 |
Monday's note said 56,277.18 "is the level it reclaimed on Friday and has held since". It held for two more sessions and then went by more than eight hundred points in one.
Where it sits. The close is 19.92 above 55,418.58 — on it, from above, the tightest any of the four finished to a marked level today. Below that, 55,102.72 is 335.78 (0.61%) and 54,648.95 is 789.55 (1.42%).
The descending channel that has framed this index since July is still in force, and price has now fallen to its lower boundary rather than bouncing inside it. The standing caution on this index through the recovery — that a higher low inside a descending channel is still inside a descending channel — has resolved in the channel's favour.
The week is −1.63%.
Marked levels. Above 55,734.43 · 56,277.18 · 56,539.65 · 56,873.30 · 57,135.71. Below 55,418.58 · 55,102.72 · 54,648.95.
CRUDE OIL (MCX, 19 Oct fut) — 24 September 2026
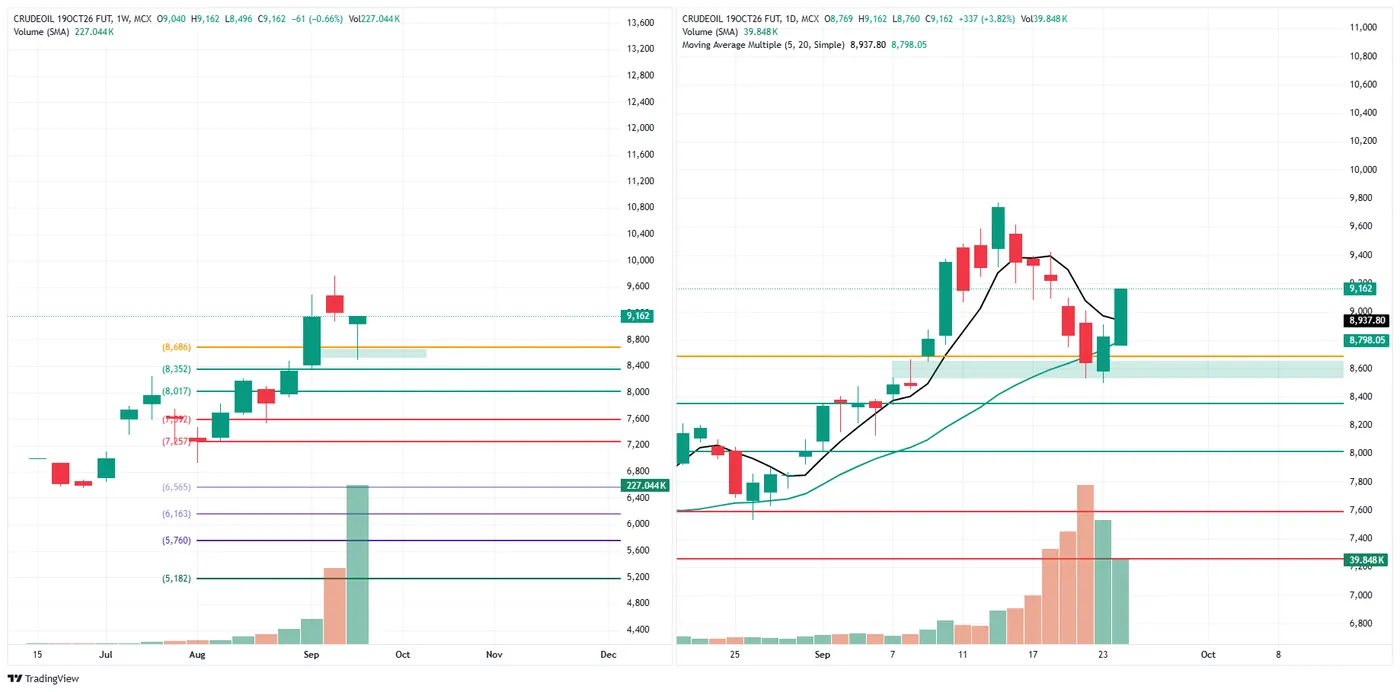
Intraday — the equity sections above are closes; this one is not. MCX trades until 23:30 and these figures are as at about 20:15 IST, with roughly three hours left to run. They will move.
9,162, up 337 (+3.82%), open 8,769, high 9,162, low 8,760. Volume 39.848K.
This is a different contract. The 21 September future expired on Monday, so the front month is now 19OCT26 and its prices are not continuous with the series carried in last week's notes. The 9,160 that the September contract settled at and the 9,162 here are different instruments that happen to be close together; the five consecutive lower closes tracked through last week ended with that contract's life and do not extend into this one.
It is trading at its high — the last print and the session high are the same number, 402 above the low, the whole of a 402-point range, and 393 above its own open. On a day when every equity index on this page gapped down and closed near the bottom of its range, crude is doing the exact opposite in the strongest form available.
On the week it is still down, 61 points (−0.66%) — and that is the interesting part. The week's low was 8,496 and price is now 666 above it, or +7.84%, at the top of its weekly range while still showing a negative weekly change. It fell hard early in the week and has taken all of it back bar sixty points.
Above both averages, the 5-day at 8,937.80 by 224.20 and the 20-day at 8,798.05 by 363.95. The expiring September contract spent its last sessions below its fast average; this one is clear of both.
Where it sits. Every marked level on this chart is below price — the nearest, 8,686, is 476 away (5.20%), then 8,352 and 8,017. There is no marked resistance overhead at all, so the only reference above is the high it is currently setting.
Marked levels. Below 8,686 · 8,352 · 8,017 · 7,592 · 7,257 · 6,565 · 6,163 · 5,760 · 5,182.
GOLD (MCX, 5 Oct fut) — 24 September 2026
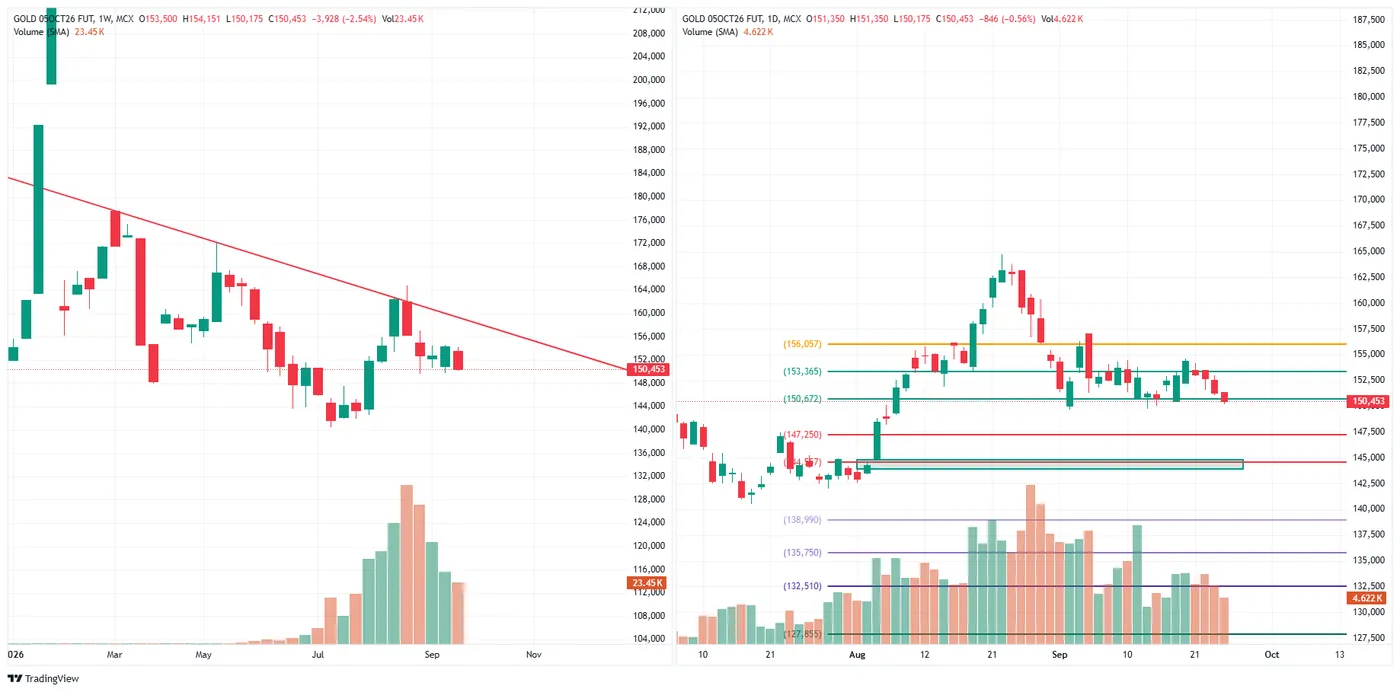
Intraday, like crude — MCX trades to 23:30 and these figures are as at about 20:15 IST. The equity sections are closes.
150,453, down 846 (−0.56%), open 151,350, high 151,350, low 150,175.
The open and the high are the same number. Gold has not traded above where it opened at any point today, and sits 897 below that open, 23.7% of the way up a 1,175-point range.
The week is −2.54%, which is much the larger number and makes gold the second-weakest instrument on this page over the week, behind only the midcap index. Last week it closed +0.97% and 93% of the way up its weekly range, the strongest thing here. It is now 7.0% of the way up this week's range.
A second level has gone. The retracement ladder has come apart in order:
| vs the level | ||
|---|---|---|
| 18 Sep | 154,263 | +898 above 153,365 |
| 21 Sep | 153,069 | −296 — 153,365 lost |
| 24 Sep | 150,453 | −219 — 150,672 lost |
Both breaks are small in points — 296 and 219 — but they are the two nearest marks below price taken out in three sessions, and price is now sitting just under the second of them rather than recovering back above.
Below, the next mark is 147,250, 3,203 away (2.13%), which is a much wider gap than anything gold has had underneath it this month. Above, 153,365 is 2,912 back (1.94%).
On the weekly chart price remains beneath the long falling line off the spike high — unchanged, and not challenged during last week's rally either.
Marked levels. Above 150,672 · 153,365 · 156,057. Below 147,250 · 144,867 · 138,990 · 135,750 · 132,510 · 127,855.
SILVER (MCX, 4 Dec fut) — 24 September 2026
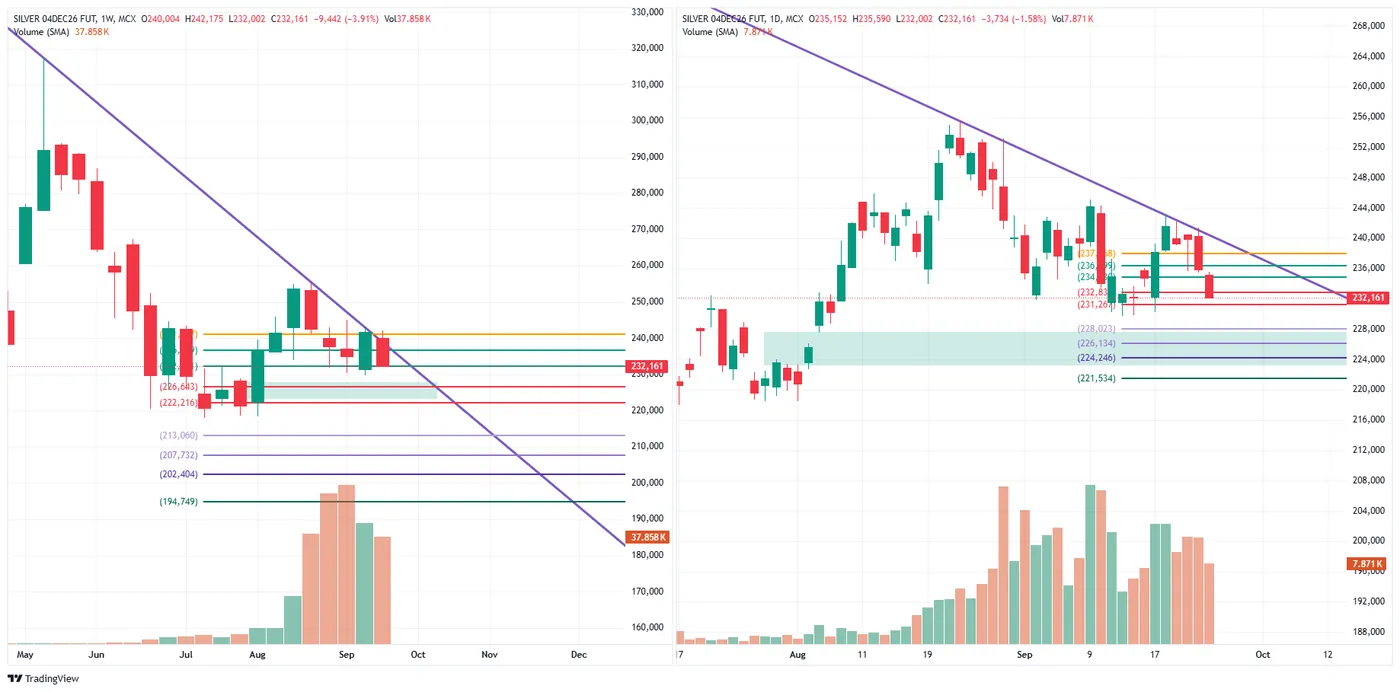
Intraday — MCX trades to 23:30 and these figures are as at about 20:15 IST.
232,161, down 3,734 (−1.58%), open 235,152, high 235,590, low 232,002.
It is the weakest instrument on this page over the week, down 9,442 (−3.91%) — worse than the midcap index's −3.18%, and it is sitting 1.6% of the way up a 10,173-point weekly range, close to the bottom of it.
Today it has given up 2,991 from its own open and trades 159 above the day's low, 4.4% of the way up a 3,588-point range. The low of the day and the low of the week are the same number, 232,002, so silver is at its worst level of the week as this is written.
Read next to gold, the two metals are doing the same thing at different intensities — gold −0.56% today and −2.54% on the week, silver −1.58% and −3.91%. Silver is falling faster on both horizons — 2.8 times gold's fall on the day, 1.5 times on the week — which is the ordinary relationship between them rather than a divergence; it is the more volatile of the pair and it is behaving like it. So of the three commodities on this page two are moving together and one is not, and the one standing apart is crude, up 3.82%.
Where it sits. Directly beneath a dense cluster of marks that price spent the last fortnight inside, and above a gap: 228,023 is 4,138 below (1.78%), then 226,134 at 6,027 (2.60%), 224,246 at 7,915 (3.41%) and 221,534 at 10,627 (4.58%).
On the weekly chart the falling line drawn off the spring high has been closing on price all quarter — the line coming down, price coming down more slowly — and the two are now at the same level. Which way it resolves is not something this chart answers.
Marked levels. Below 228,023 · 226,134 · 224,246 · 221,534.
INDIA VIX — 24 September 2026
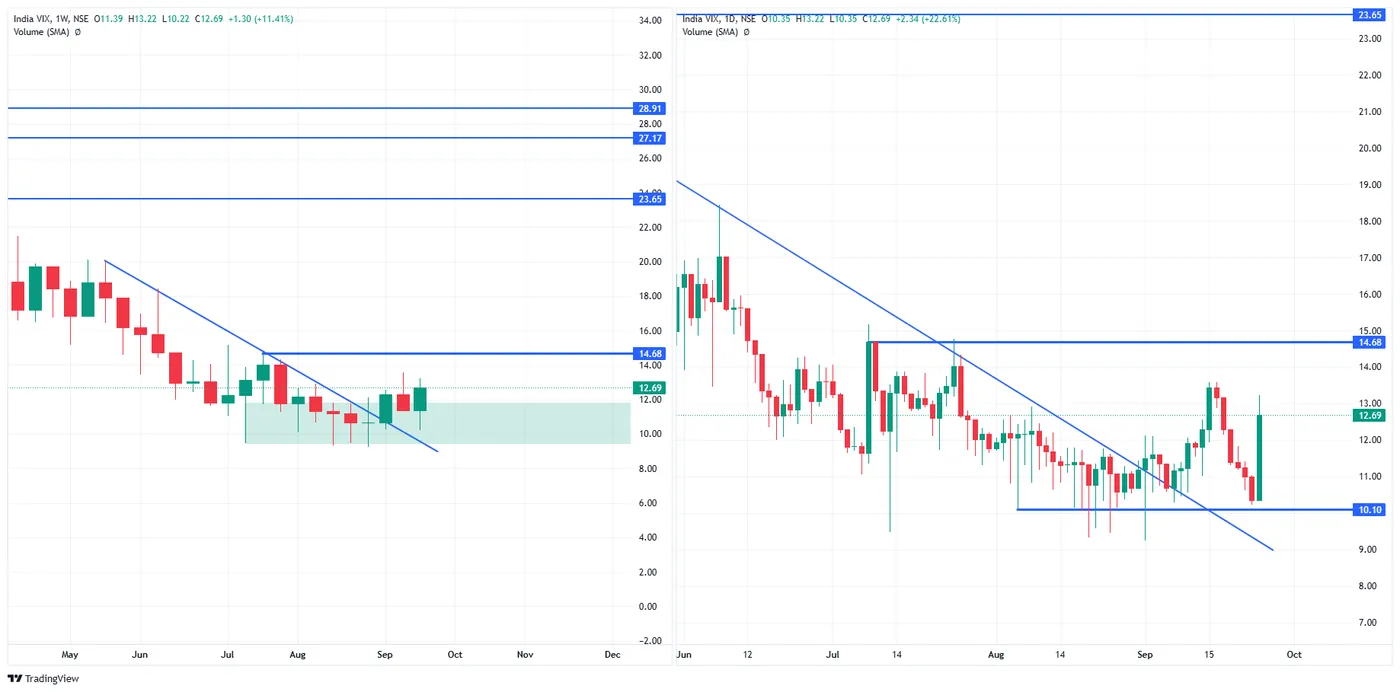
Close 12.69, up 2.34 (+22.61%), open 10.35, high 13.22, low 10.35.
The open, the low and Wednesday's close are all 10.35. Volatility never traded below where it opened at any point today; it was bid from the first print and finished 81.5% of the way up a 2.87-point range.
That is the exact inverse of 18 September, six sessions ago:
| Open | High | Low | Close | Shape | |
|---|---|---|---|---|---|
| 18 Sep | 12.29 | 12.29 | 11.31 | 11.39 | open = high = prior close → sold all day, −7.32% |
| 24 Sep | 10.35 | 13.22 | 10.35 | 12.69 | open = low = prior close → bid all day, +22.61% |
The same degenerate bar, reflected. On the 18th this note said two days of that behaviour was "what turns Friday's collapse from an event into a state". The state lasted four sessions.
The path there. 11.39 on the 18th, 11.25 on Monday, a low of 10.22 somewhere midweek — lower than anything seen during the selloff volatility was bought for — and 12.69 now. On Monday this page noted that 11.25 was below any level reached in the selloff and added that it described what options cost, not what came next. What came next was 10.22 and then a 22.61% day.
On the week it is +11.41%, closing 82.3% of the way up its weekly range, and it is one of only two things on this page that is higher.
Where it sits. 14.68 is 1.99 above (15.7%) and 10.10 is 2.59 below (20.4%) — the band volatility has traded inside since August. Today's high of 13.22 came within 1.46 of the upper edge without reaching it. The marks above that — 23.65, 27.17, 28.91 — belong to April and are 86% or more away.
Marked levels. Above 14.68 · 23.65 · 27.17 · 28.91. Below 10.10.
Read across the session
| Day | Position in its range | Week so far | |
|---|---|---|---|
| India VIX | +22.61% | 81.5% | +11.41% |
| Crude oil (Oct) * | +3.82% | 100% | −0.66% |
| Gold (Oct) * | −0.56% | 23.7% | −2.54% |
| Silver (Dec) * | −1.58% | 4.4% | −3.91% |
| Nifty 50 | −1.64% | 7.2% | −1.21% |
| Sensex | −1.67% | 2.1% | −0.96% |
| Bank Nifty | −1.96% | 16.9% | −1.63% |
| Nifty Midcap Select | −3.65% | 4.1% | −3.18% |
* crude, gold and silver are intraday, as at about 20:15 IST; the indices and VIX are closes.
Two things rose and six fell, and the two that rose are the two that usually do on a day like this. Volatility gained 22.61% — by a wide margin the largest move on the page in either direction — and crude 3.82%. Every index and both metals are lower.
Ranked by the week rather than the day the order changes: silver is the weakest at −3.91%, ahead of the midcap's −3.18%, while crude, which is having the best single session here, is the smallest weekly faller at −0.66%.
Crude is on one side of this session and everything else is on the other. It is up 3.82% and trading at its high; nothing else here is higher on the day, and no index closed above 17% of its own range. The gap between crude's position and the best index reading of 16.9% is wider than the spread across all four indices put together.
Crude has separated from the metals, and the metals have not separated from each other. Gold is −2.54% on the week and silver −3.91%, both near the bottom of their weekly ranges; crude is at the top of both its day and its week. Last Friday it was gold at 93% of its weekly range and crude at 22.6% — the same split, the other way round. Whatever is moving crude is not moving the metals, and it has now been true for two weeks with the sign reversed each time.
On the week, the ranking is not the same as on the day. Crude is the smallest weekly faller at −0.66% despite today's surge; the midcap is the largest at −3.18%; and gold, which fell least today of the five decliners, is second-worst on the week at −2.54%. A single session's change and a week's change are telling different stories about the same instruments.
Every index gapped lower at the open and not one of them filled it — Bank Nifty by 838.30, the Sensex by 555.85, the midcap by 236.10, the Nifty by 225.00. Three basis points separate the Nifty and the Sensex on the day, which is itself a change from the last four sessions when the two kept diverging on where they closed inside their ranges. The midcap fell more than twice as far as either large cap, and on the week it is down more than three times what the Sensex is.
Both large caps are now below all four of their moving averages, on both timeframes.
Every one of the four broke a line that held on 16 September
This is the finding of the session, and it is the same date in all four cases:
| The line | On 16 Sep | Today | |
|---|---|---|---|
| Nifty 50 | its low, 23,116.10 — the floor the bounce began from | was the low | closed 53.00 under |
| Sensex | 73,955.58 | held by 25.75 | −375.04 |
| Bank Nifty | 55,734.43 | held by 77.77 | −295.93 |
| Nifty Midcap Select | 14,121.51 | held by 11.79 | −81.21 |
Four indices, four different lines, none of them related to each other except by the session they were set in. On the 16th each of those holds was written up here as the day's small good news — the Sensex's low stopping 25.75 short, the midcap's stopping 11.79 short, the Bank Nifty never testing its level at all. Eight days later all four are beneath them.
Two indices also gave back a level they had reclaimed during the recovery: the Sensex's 74,476.54, retaken on the 21st, and the Bank Nifty's 56,277.18, retaken on the 18th. Both were described here at the time as the first thing each index had resolved. Neither survived the week.
What the institutional flow did
| FII net | DII net | Net of the two | DII cover of FII selling | |
|---|---|---|---|---|
| 21 Sep | −₹576.20 Cr | +₹2,797.27 Cr | +₹2,221.07 Cr | 4.85× |
| 22 Sep | −₹3,809.99 Cr | +₹4,120.07 Cr | +₹310.08 Cr | 1.08× |
| 23 Sep | +₹1,617.45 Cr | +₹2,341.46 Cr | +₹3,958.91 Cr | — |
| 24 Sep | −₹5,027.36 Cr | +₹4,301.18 Cr | −₹726.18 Cr | 0.86× |
Today is the largest single day of foreign selling in September — ₹5,027.36 Cr, ahead of the 22nd's ₹3,809.99 Cr and the 17th's ₹3,208.76 Cr. Domestic buying was also large, at ₹4,301.18 Cr, and it was not enough: the cover ratio is 0.86 and the net of the two is negative at −₹726.18 Cr.
That has now happened exactly twice this month:
| Cover | What the indices did | |
|---|---|---|
| 15 Sep | 0.90× | every index closed on its low |
| 24 Sep | 0.86× | both closed within 7% of their lows |
Every other September session with FII selling saw DII buying exceed it, and on every one of those the indices closed off their lows. The two exceptions are the two days the market closed at the bottom of its range. Three weeks of sessions now sit on the same side of that line.
The usual limits still apply, and one of them matters more today than usual: these are net figures across all participants in a category, two observations of a threshold are not a rule, and flow published after the close cannot have caused the candles that produced it. The relationship is worth watching precisely because it keeps holding, not because it has been shown to be causal.
Descriptive commentary on price structure and marked levels. It is not advice, not a recommendation, and contains no targets or entry levels. NEOGreeks is not a SEBI-registered investment adviser.