NIFTY 50 — 21 September 2026
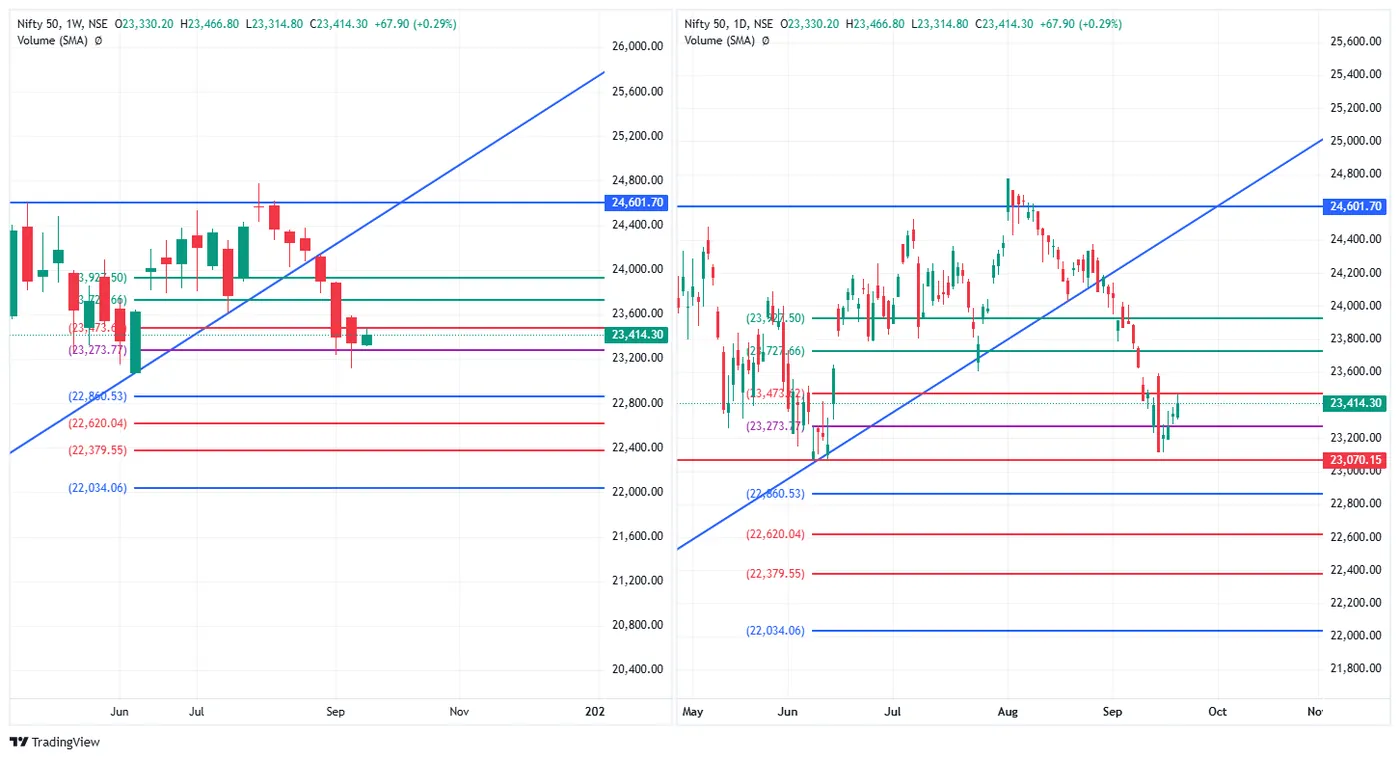
Close 23,414.30, up 67.90 (+0.29%), open 23,330.20, high 23,466.80, low 23,314.80.
A 152-point range, closed 99.50 above the low and 84.10 above the open — 65.5% of the way up the day. The low of 23,314.80 never went near Friday's close; the session's worst level was 31.60 points below where Friday finished.
Fourth consecutive higher close. From the Wednesday low of 23,116.10 the index has now recovered in a straight line:
| Close | Off the 16 Sep low | |
|---|---|---|
| 16 Sep | 23,217.60 | +0.44% |
| 17 Sep | 23,270.60 | +0.67% |
| 18 Sep | 23,346.40 | +1.00% |
| 21 Sep | 23,414.30 | +1.29% |
Four sessions, each one finishing higher than the last, and none of them large: the biggest single day in that run is Friday's 75.80 points. It is a slow recovery rather than a sharp one, and the new week has started by continuing it rather than by testing it.
Where it sits. Between 23,473.62, which is 59.32 above (0.25%), and 23,273.77, 140.53 below (0.60%). That band is 199.85 points wide and the close is 70.3% up it — pressed against the upper edge rather than centred, which is the difference from Friday, when price sat near the middle of its pocket.
23,473.62 is now the nearest thing to a decision point on the chart: the high of 23,466.80 came within 6.82 points of it and stopped. Above it the next marks are 23,727.66 (1.34%) and 23,927.50 (2.19%); 24,601.70 remains 5.07% overhead and untouched since the fall.
The rising line from the April low is still broken on the weekly chart, and nothing in this session approached it.
Marked levels. Above 23,473.62 · 23,727.66 · 23,927.50 · 24,601.70. Below 23,273.77 · 23,070.15 · 22,860.53 · 22,620.04 · 22,379.55 · 22,034.06.
SENSEX — 21 September 2026
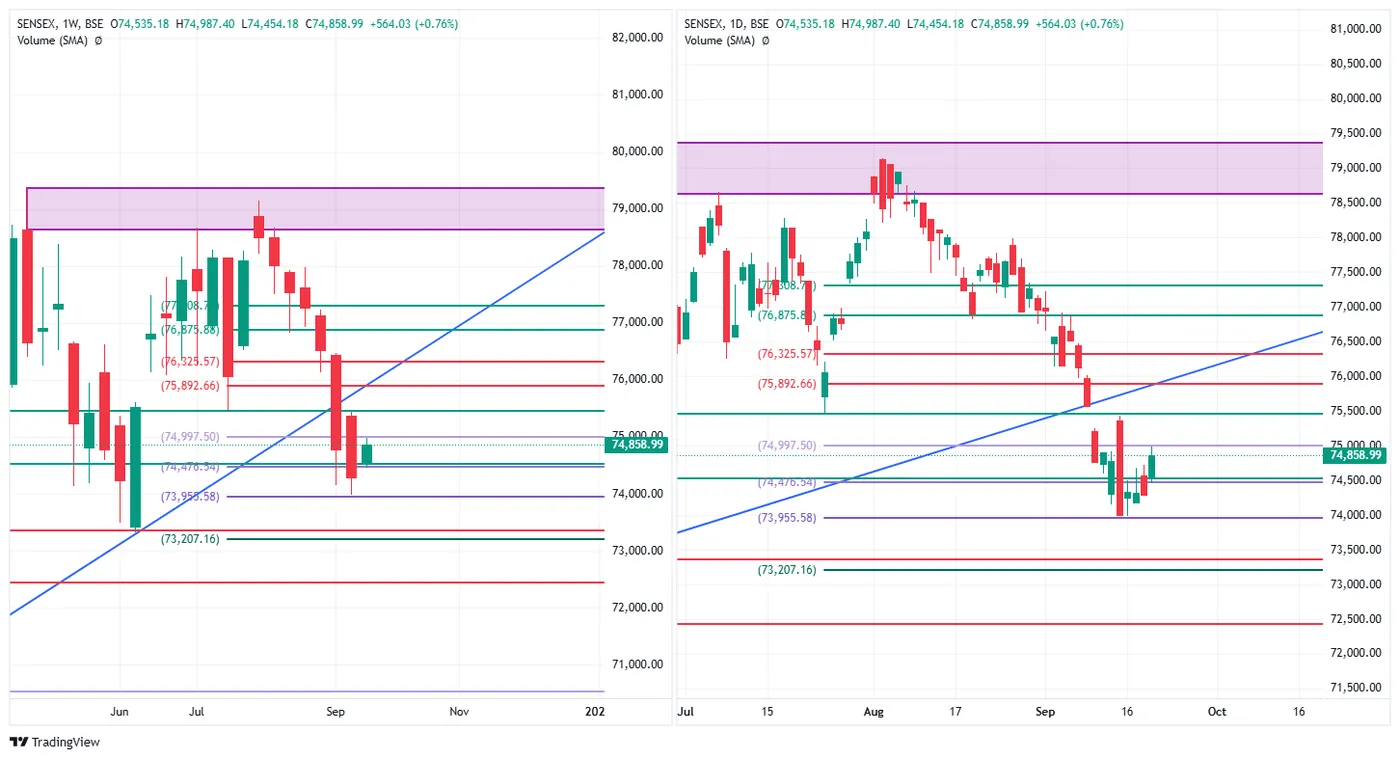
Close 74,858.99, up 564.03 (+0.76%), open 74,535.18, high 74,987.40, low 74,454.18.
A complete reversal of Friday. On Friday the Sensex closed on its low, gave up a 433-point range entirely, and was the weakest thing on the page. Today it closed 75.9% of the way up a 533-point range, 323.81 above its own open, and gained more than two and a half times what the Nifty did.
| Friday | Monday | |
|---|---|---|
| Sensex | −0.03%, closed 0% up its range | +0.76%, closed 75.9% up it |
| Nifty 50 | +0.33%, closed 58.3% up its range | +0.29%, closed 65.5% up it |
74,476.54 has been reclaimed. That is the level the index lost on the 15th and then failed at for three sessions running:
| Close | vs 74,476.54 | |
|---|---|---|
| 15 Sep | 74,003.82 | −472.72 |
| 16 Sep | 74,336.45 | −140.09 |
| 17 Sep | 74,314.59 | −161.95 |
| 18 Sep | 74,294.96 | −181.58 |
| 21 Sep | 74,858.99 | +382.45 |
On the 16th the high went 29.32 points through it and the close came back below. Today the close is 382.45 above — the first finish above that line since the 15th, and the first thing this index has resolved in a week.
And it stopped just under the next one. 74,997.50 is 138.51 above the close, and the high of 74,987.40 came within 10.10 points of it. The Nifty did the same thing on the same day: its high stopped 6.82 points short of 23,473.62. Both indices ran at their next marked level, touched the approach and closed beneath it.
Below, 73,955.58 — the floor Wednesday's low stopped 25.75 short of — is now 903.41 away (1.21%), and no longer in play in the way it was last week.
Marked levels. Above 74,997.50 · 75,892.66 · 76,325.57 · 76,875.88 · 77,308.70. Below 74,476.54 · 73,955.58 · 73,207.16.
BANK NIFTY — 21 September 2026
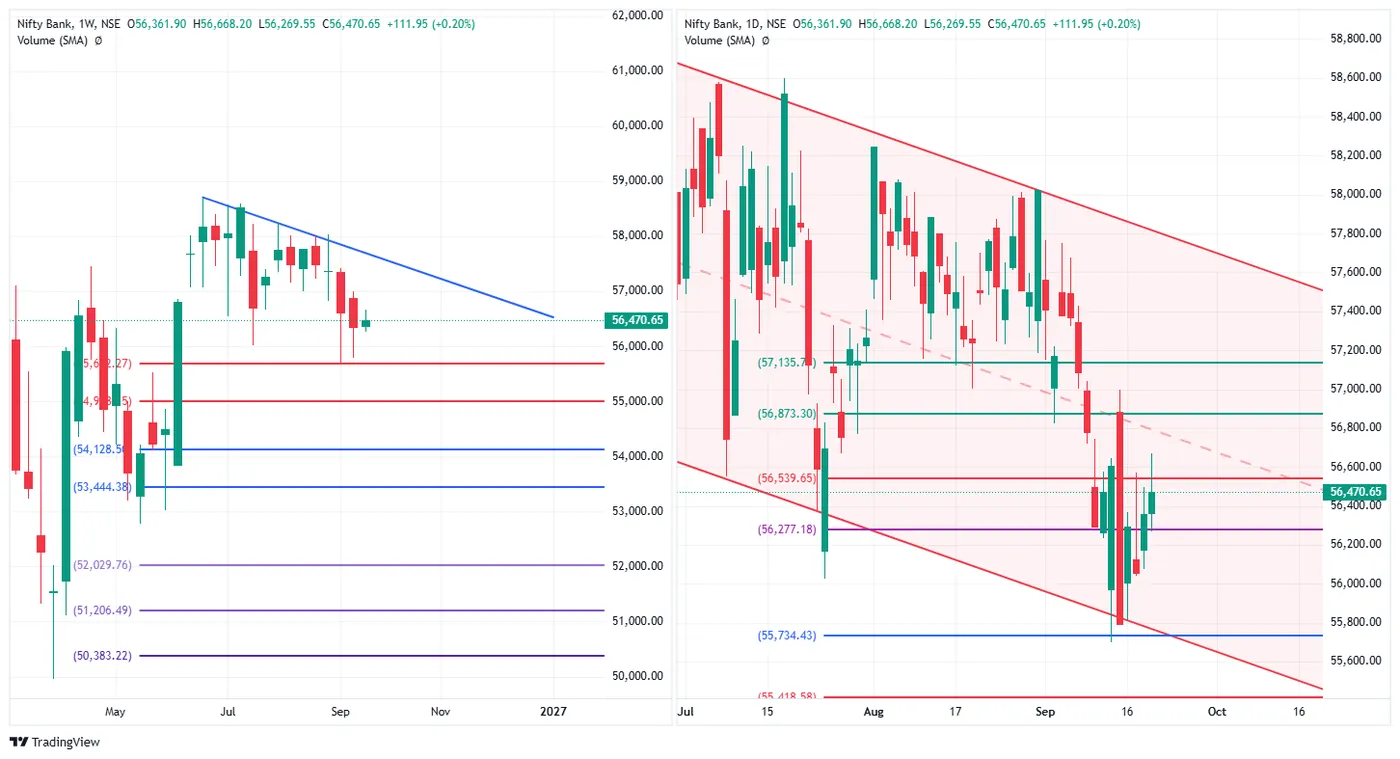
Close 56,470.65, up 111.95 (+0.20%), open 56,361.90, high 56,668.20, low 56,269.55.
A 398.65-point range closed 50.4% of the way up — dead centre, and the smallest gain of the three. Friday's order has inverted completely:
| Friday | Monday | |
|---|---|---|
| Bank Nifty | +0.54% (strongest) | +0.20% (weakest) |
| Nifty 50 | +0.33% | +0.29% |
| Sensex | −0.03% (weakest) | +0.76% (strongest) |
It is the only one of the three that actually reached its next level — and it failed there. The high of 56,668.20 went 128.55 points through 56,539.65, and the close came back 69.00 below it. Set against the other two, the three indices did three different things at the same kind of line on the same day:
| At the next marked level above | |
|---|---|
| Nifty 50 | high stopped 6.82 short — never touched |
| Sensex | high stopped 10.10 short — never touched |
| Bank Nifty | high went 128.55 through — closed back below |
Two indices declined the test and one took it and lost. That is a more useful distinction than the day changes, which put Bank Nifty last on a technicality of 9 basis points.
Where it sits. In a 262.47-point pocket between 56,539.65 just above (69.00, 0.12%) and 56,277.18 below (193.47, 0.34%), 73.7% of the way up it. 56,277.18 is the level it reclaimed on Friday and has held since.
On the daily chart the descending channel that has framed this index since July is still in force and price is still inside it; on the weekly, the falling line off the July highs sits just overhead. Neither has been broken by four sessions of recovery.
Marked levels. Above 56,539.65 · 56,873.30 · 57,135.71. Below 56,277.18 · 55,734.43 · 55,418.58.
NIFTY MIDCAP SELECT — 21 September 2026
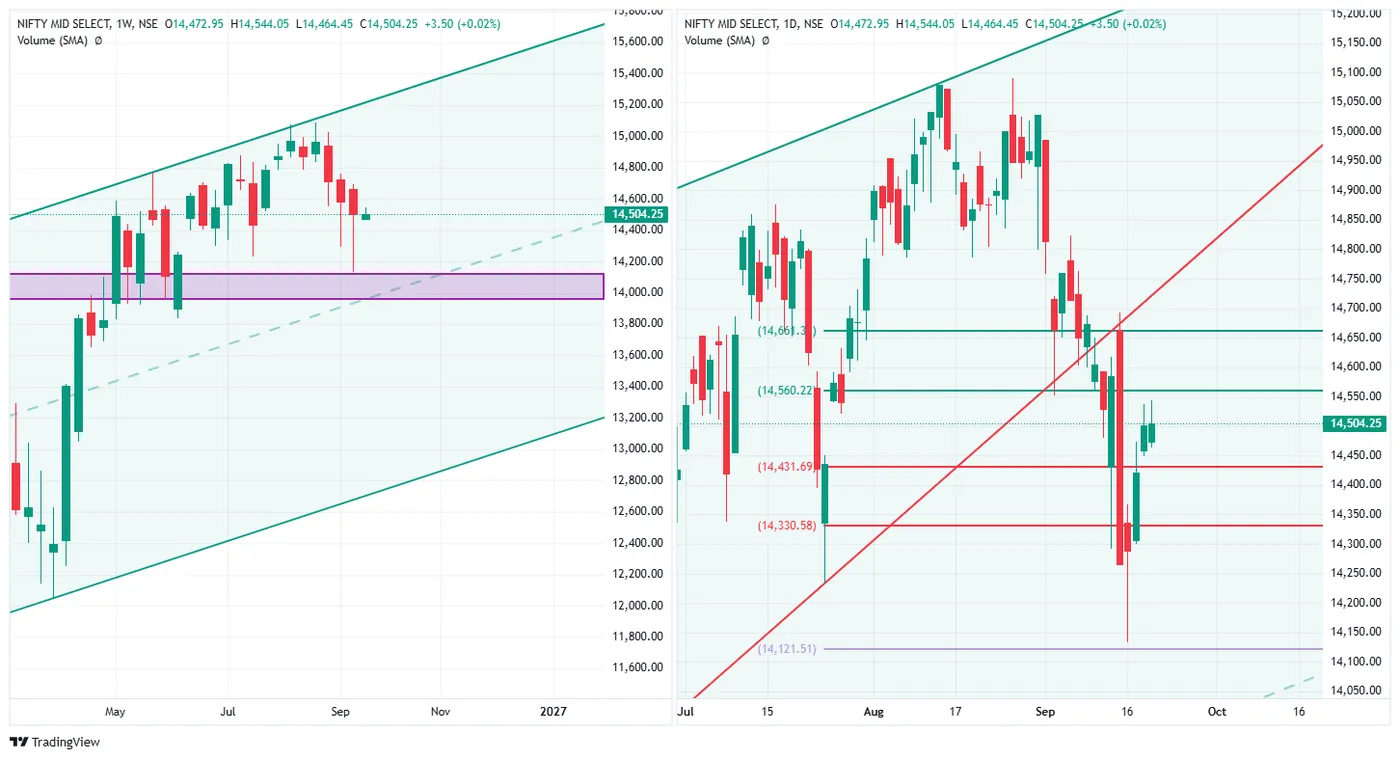
Close 14,504.25, up 3.50 (+0.02%) — unchanged to two decimal places of a percent — open 14,472.95, high 14,544.05, low 14,464.45.
A 79.60-point range, and the close is 39.80 above the low: exactly half of it. Of the four indices this is the narrowest day and the most perfectly neutral close, and it follows Friday's 89.05-point range, which was itself the narrowest of that day. Two sessions in a row of the midcap index doing almost nothing, immediately after the week in which it moved more than anything else.
That is the notable thing here. Last week this index fell furthest and bounced furthest — 2.60% off its weekly low against roughly 1% for the large caps. It has now spent two sessions going nowhere while the Sensex put on 0.76% in one.
Where it sits. 55.97 below 14,560.22 and 72.56 above 14,431.69 — 56.5% of the way up a 128.53-point band, the same pocket it was in on Friday and barely moved within it. 14,661.31 is 157.06 above.
On the weekly chart the rising channel remains intact and price is inside it.
Marked levels. Above 14,560.22 · 14,661.31. Below 14,431.69 · 14,330.58 · 14,121.51.
INDIA VIX — 21 September 2026
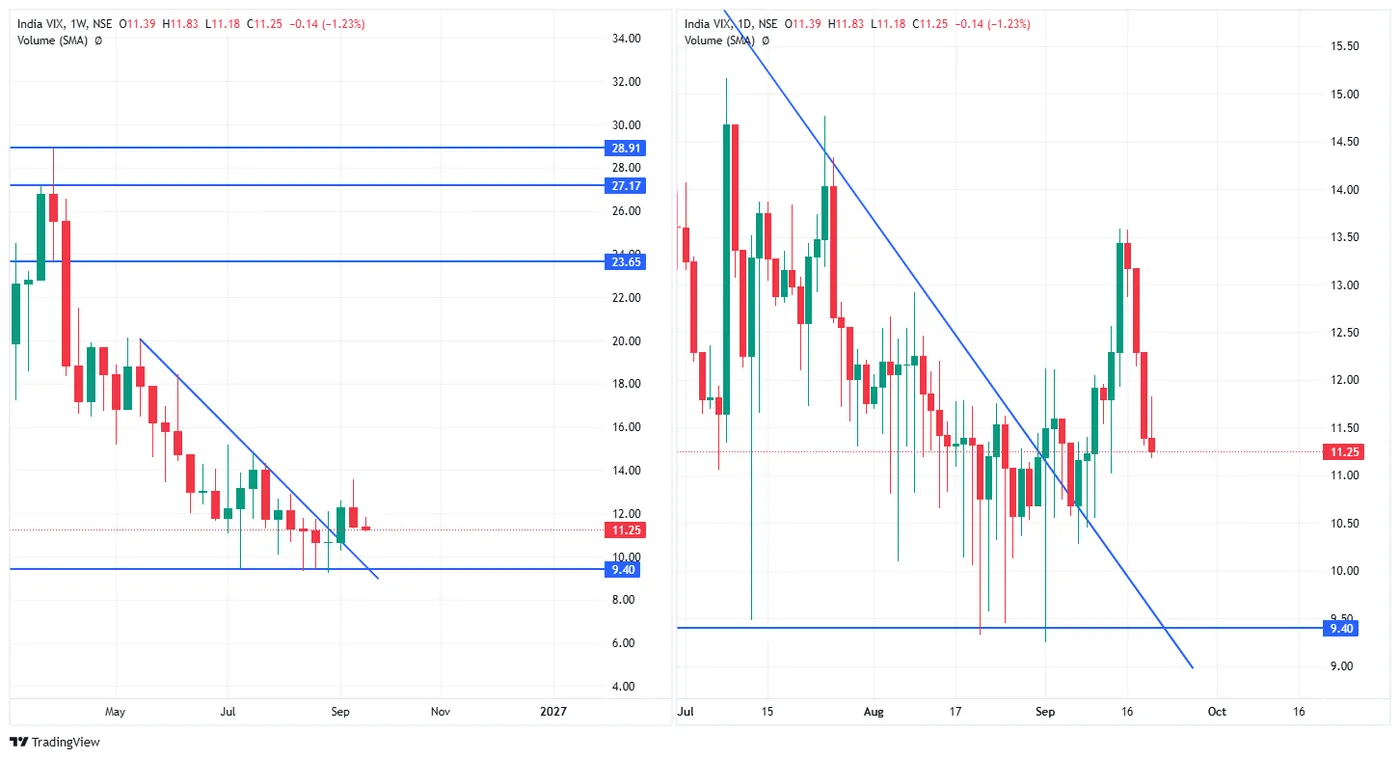
Close 11.25, down 0.14 (−1.23%), open 11.39, high 11.83, low 11.18.
A second consecutive fall, and a second consecutive close near the low — 0.07 above it, 10.8% of the way up a 0.65-point range. The open of 11.39 is Friday's close exactly, so as on Friday, volatility started the day where it finished the last one and was sold from there.
Friday's session was the violent one: −7.32%, with the high equal to the previous close. Today's is the quieter confirmation — a smaller range, a smaller fall, and the same shape. Two days of the same behaviour is what turns Friday's collapse from an event into a state.
The marked floor at 9.40 is 1.85 below (16.4%). Above, the next marks — 23.65, 27.17, 28.91 — are so far away as to be irrelevant to anything but the memory of April.
At 11.25 the price of protection is now lower than at any point in the selloff it was bought for. That describes what options cost, not what comes next.
GOLD (MCX, 5 Oct fut) — 21 September 2026
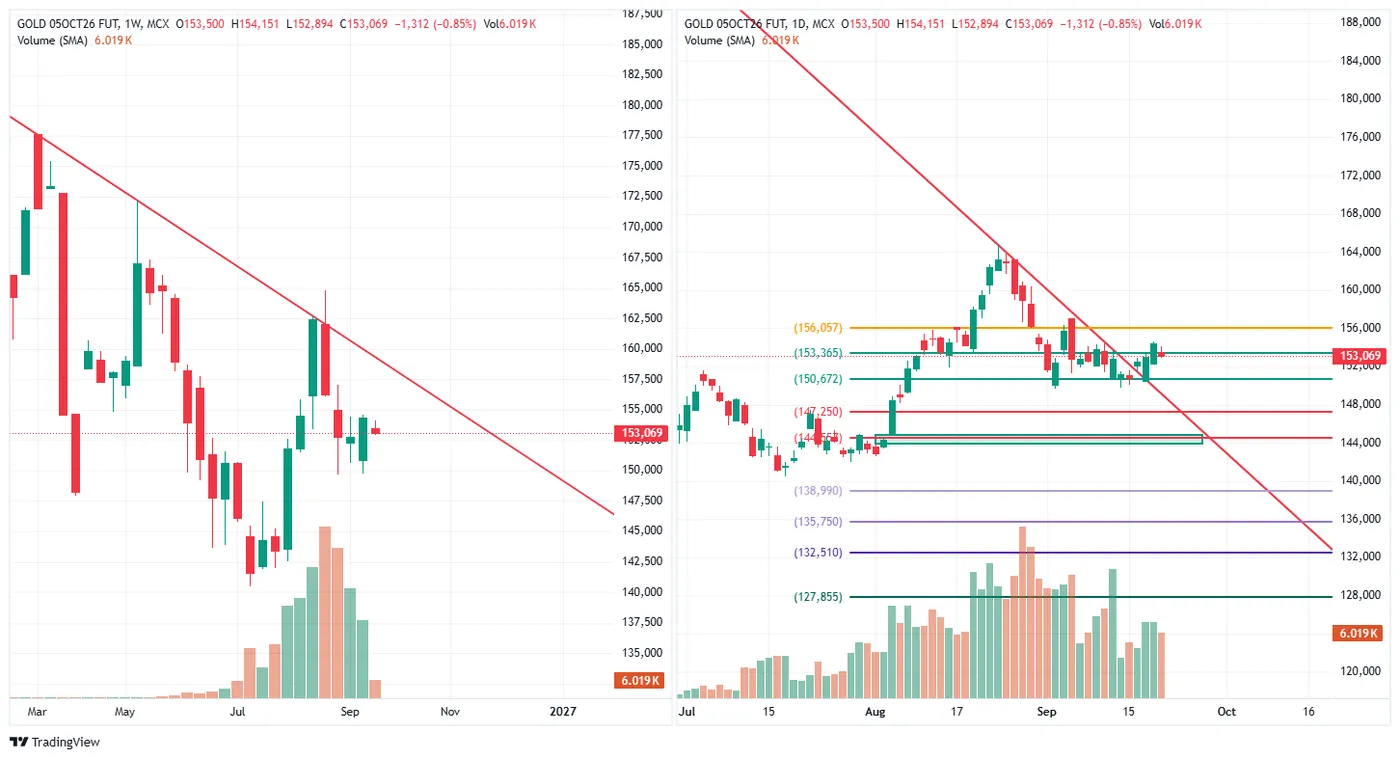
Close 153,069, down 1,312 (−0.85%), open 153,500, high 154,151, low 152,894.
The mirror of Friday. On Friday gold closed 93% of the way up its weekly range, the strongest close on the page. Today it closed 13.9% of the way up its range, 431 below its own open, and is the weakest instrument here bar volatility itself.
153,365 has been lost. That is the half-retracement level gold cleared last week — it stopped 415 short of it on Wednesday the 16th, closed 898 above it on Friday, and is now 296 below. One session has undone the week's advance past that line.
Below, 150,672 is 2,397 away (1.57%); above, 156,057 is 2,988 (1.95%). The close sits inside the wide gap between them with nothing near, which is why a 1,257-point range moved it back under one line and nowhere near another.
On the weekly chart price remains beneath the long falling line off the spike high — the cap that has held all year and was not challenged last week either.
Marked levels. Above 153,365 · 156,057. Below 150,672 · 147,250 · 144,867 · 138,990 · 135,750 · 132,510 · 127,855.
CRUDE OIL (MCX, 21 Sep fut) — 21 September 2026
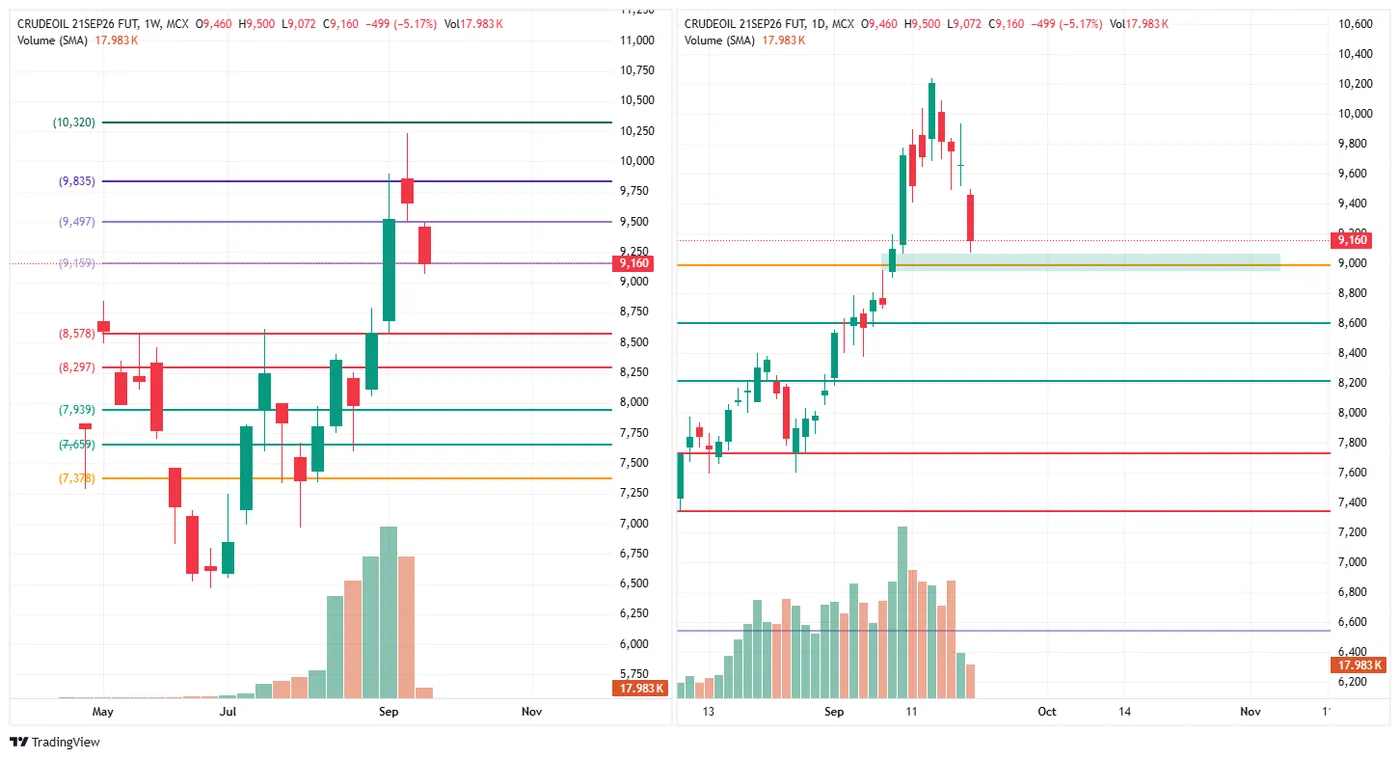
Close 9,160, down 499 (−5.17%), open 9,460, high 9,500, low 9,072. Volume 17.983K. This contract expired today, so this is its final session.
The biggest single-day fall of the run, and the close finished 300 below its own open and only 20.6% of the way up a 428-point range.
Five sessions, five lower closes:
| Close | |
|---|---|
| 15 Sep | 10,215 |
| 16 Sep | 9,816 |
| 17 Sep | 9,758 |
| 18 Sep | 9,662 |
| 21 Sep | 9,160 |
From the 15 September close that is −1,055 (−10.33%), and from the 10,238 weekly high −1,078 (−10.53%). The spike that took crude up 7.22% in a week has been fully retraced and then some.
The pocket broke. On Friday the close sat 48.8% of the way up the 9,497–9,835 band, almost exactly between the two. Today price went straight through the floor of it: 9,497 is now 337 above (3.68%).
And it stopped on the next line. The close of 9,160 is one point above 9,159. Whatever weight to give a single point, the level the daily chart marked below the broken pocket is where the session finished.
On the volume, the same caution as Friday, more so. 62.053K on the 15th, 50.835K on the 16th, 24.739K on the 18th, 17.983K today — under a third of Tuesday's. This was expiry day for the 21SEP26 contract, so the thinning is the roll completing, and a −5.17% move on an expiring contract's last session carries settlement mechanics that a mid-life session does not. The direction matches the four sessions before it, which is the reason to take it seriously; the magnitude on this particular day is the part to discount.
Marked levels. Above 9,497 · 9,835 · 10,320. Below 9,159 · 8,578 · 8,297 · 7,939 · 7,659 · 7,378.
Read across the session
Ranking everything by where it finished inside its own day separates the session cleanly in a way the percentages alone do not:
| Closed in its range | Day | |
|---|---|---|
| Sensex | 75.9% | +0.76% |
| Nifty 50 | 65.5% | +0.29% |
| Bank Nifty | 50.4% | +0.20% |
| Nifty Midcap Select | 50.0% | +0.02% |
| Crude oil | 20.6% | −5.17% |
| Gold | 13.9% | −0.85% |
| India VIX | 10.8% | −1.23% |
The four equity indices occupy the top half of that list and the three non-equity instruments the bottom, with no overlap. Every index closed at or above the midpoint of its own range; crude, gold and volatility all closed in the bottom quarter of theirs.
Crude is the outlier on magnitude as well as direction — a 5.17% fall on a day when nothing else moved more than 0.85% — though it was that contract's expiry session, which is the reason to weigh the direction more than the size.
The ordering inside the equities is also the reverse of Friday's. The Sensex was last on Friday and is first today; the Bank Nifty was first and is now third. The midcap index, which dominated last week's moves in both directions, has produced two of the narrowest sessions on this page back to back.
What the institutional flow did
| FII net | DII net | Net of the two | DII cover of FII selling | |
|---|---|---|---|---|
| 17 Sep | −₹3,208.76 Cr | +₹3,617.75 Cr | +₹408.99 Cr | 1.13× |
| 18 Sep | +₹599.54 Cr | +₹1,019.69 Cr | +₹1,619.23 Cr | — |
| 21 Sep | −₹576.20 Cr | +₹2,797.27 Cr | +₹2,221.07 Cr | 4.85× |
Foreign money went back to selling after Friday's single day of buying, but only ₹576.20 Cr of it — the smallest selling day since the 10th, and a fifth of Thursday's. Domestic buying came back to ₹2,797.27 Cr.
The cover ratio is the number that stands out: 4.85×. Domestic institutions bought nearly five times what foreign institutions sold. For comparison, the ratio was 0.90 on the 15th when every index closed on its low, 1.92 on the 16th, and 1.13 on the 17th. The net of +₹2,221.07 Cr is the largest of any session in this stretch.
Read with the price: a 152-point range and a 0.29% gain is not what ₹2,221 Cr of net institutional buying usually produces. The buying was large and the move was small, which says the selling it absorbed was real even though the headline FII figure was modest.
Three limits, unchanged. These are net figures across all participants in a category, so they describe an aggregate and not any one desk. One session is not a trend. And flow published after the close cannot have caused the candles that produced it.
Descriptive commentary on price structure and marked levels. It is not advice, not a recommendation, and contains no targets or entry levels. NEOGreeks is not a SEBI-registered investment adviser.