NIFTY 50 — 18 September 2026
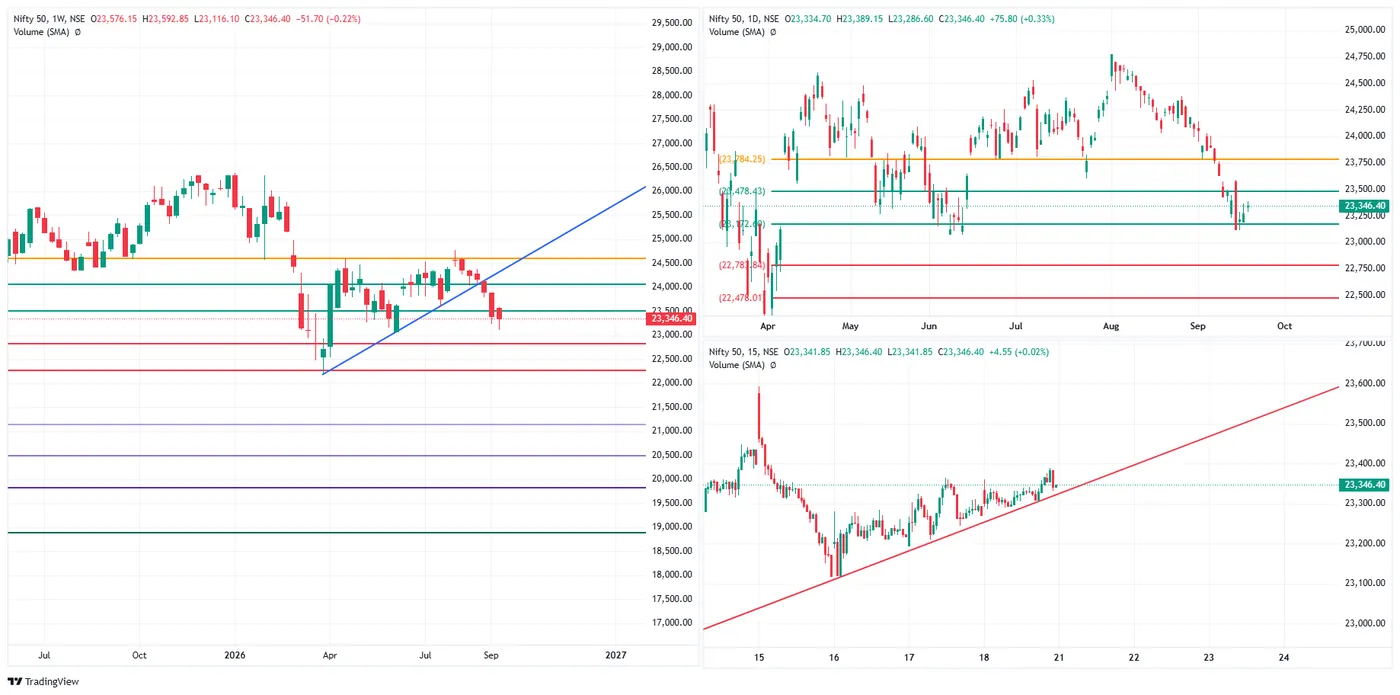
Close 23,346.40, up 75.80 (+0.33%), from an open of 23,334.70, a high of 23,389.15 and a low of 23,286.60.
The day's whole range was 102.55 points, the narrowest of the week by a wide margin, and the close finished 11.70 above its own open and about 58% of the way up that range. After three sessions that each travelled several hundred points, Friday did very little — which is itself the information.
The week, finished. It opened at 23,576.15, fell to 23,116.10 on Wednesday, and closed at 23,346.40 for a loss of just 51.70 (−0.22%). On Tuesday evening the same week was down 1.19%. From that Tuesday close of 23,118.60 the index has added 227.80 points (+0.99%) across three sessions. The weekly candle therefore ends with a long lower wick and a small body — the low was rejected by 230.30 points, and the close sits roughly halfway up a 476.75-point weekly range.
Where it sits now. The close is bracketed by two marked levels and is not especially near either: 23,478.43 is 132.03 above (0.57%), 23,172.09 is 174.31 below (0.75%). That band is 306 points wide and price is about 57% of the way up it. There is no level within half a percent in either direction, which is consistent with a 102-point day: nothing was being tested.
Above the band, 23,784.25 is 437.85 away (1.88%). Below it, 22,781.84 and 22,478.01 are 2.42% and 3.72% away.
On the weekly chart the rising line off the April low is still broken and price is still beneath it; nothing this week went near it. On the 15-minute chart the rising line drawn off the Wednesday low is intact, and Friday's close sits just above it — the short-term series of higher lows since midweek has not been broken, which is a smaller claim than a trend and should be read as one.
Marked levels. Above 23,478.43 · 23,784.25. Below 23,172.09 · 22,781.84 · 22,478.01.
SENSEX — 18 September 2026
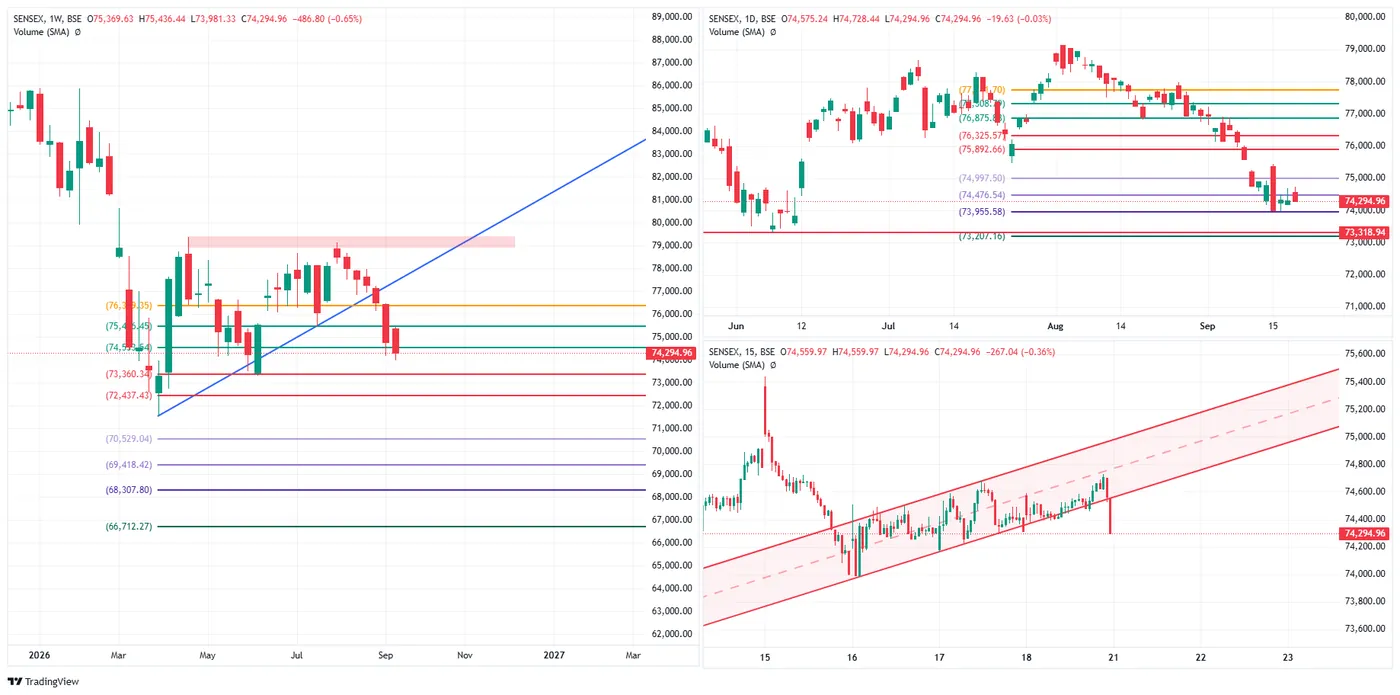
Close 74,294.96, down 19.63 (−0.03%) — flat on the day — from an open of 74,575.24 and a high of 74,728.44 against a low of 74,294.96.
The low and the close are the same number. The Sensex finished the week on its low, 280.28 below its own open, having given up the whole of a 433.48-point range. That is a different session from the Nifty's on the same day, and the difference is the point of this page today: the Nifty closed 58% of the way up a 102-point range, the Sensex closed at the bottom of a range four times wider.
The week. Down 486.80 (−0.65%), against the Nifty's −0.22%. Both indices made their low on Wednesday and recovered, but not equally: the Sensex closed 313.63 above its weekly low of 73,981.33, or +0.42%, which leaves it 21.6% of the way up its weekly range. The Nifty finished 48.3% of the way up its own. On the fall the two were comparable; on the recovery they were not.
Where it sits. Unlike the Nifty, the marked levels here are the same set these notes have used all week, so the comparison is direct. The close is 181.58 below 74,476.54 (0.24%) — the level the index lost on the 15th, retook intraday on the 16th, and has still not closed above. It is 339.38 above 73,955.58 (0.46%), which is the level Wednesday's low of 73,981.33 stopped 25.75 points short of and did not break.
So after four sessions the Sensex sits inside the same 520.96-point pocket it occupied on Tuesday evening — above the floor it tested on Wednesday, below the ceiling it failed at on Wednesday — and 41.49 points below Wednesday's own close. Both boundaries were touched during the week and neither gave way. Nothing in the level structure has been resolved.
On the 15-minute chart the rising channel that carried the recovery from Wednesday was broken on the last bar — price left it downward into the close rather than drifting out of it. The Nifty's equivalent line held. Two indices that normally move together ended the week on opposite sides of their own short-term structures.
Marked levels. Above 74,476.54 · 74,997.50 · 75,892.66 · 76,325.57 · 77,308.29. Below 73,955.58 · 73,318.94 · 73,207.16.
BANK NIFTY — 18 September 2026
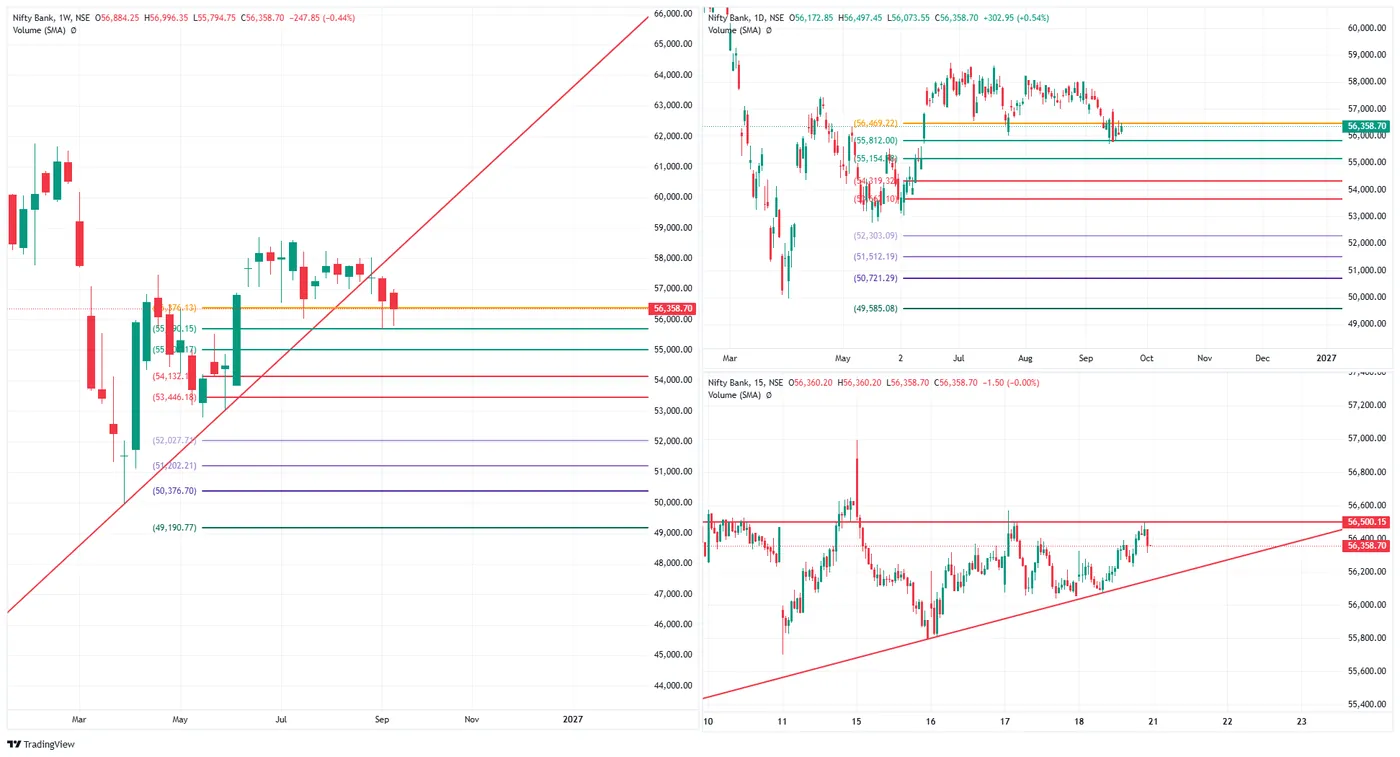
Close 56,358.70, up 302.95 (+0.54%) — the largest gain of the three — open 56,172.85, high 56,497.45, low 56,073.55.
It also closed 67.3% of the way up its own range, the highest of the three, and 185.85 above its open. On Friday the order was Bank Nifty, then the Nifty, then the Sensex, and it was the same order on both measures — the day change and the position in the range agreed, which they did not on the 16th.
Its low came a day earlier than the others. The week's low of 55,794.75 is Tuesday's close, not Wednesday's low: the Bank Nifty bottomed on the 15th and never revisited it, while the Nifty and the Sensex both made their lows on the 16th. From that Tuesday low it has added 563.95 points (+1.01%), which leaves it 46.9% of the way up its weekly range — almost exactly where the Nifty sits, and more than twice the Sensex's 21.6%.
On the week it is down 247.85 (−0.44%), between the Nifty's −0.22% and the Sensex's −0.65%.
Where it sits. The close is 110.52 below 56,469.22 — 0.20%, the nearest any of the three finished to a marked level, and it is a ceiling rather than a floor. The high of 56,497.45 went 28.23 points through it intraday and the close came back under. Below, 55,812.00 is 546.70 away (0.97%); that level sits 0.20 of a point from Wednesday's low of 55,812.20, so the floor the index bounced from on the 16th and the marked level are effectively the same line.
On the 15-minute chart the rising line off the Tuesday low is intact and price is above it, as the Nifty's is — the Sensex's is the one that broke. The horizontal at 56,500.15 capped Friday's high.
Marked levels. Above 56,469.22. Below 55,812.00 · 54,319.32 · 52,303.09 · 51,512.19 · 50,721.29 · 49,585.08.
NIFTY MIDCAP SELECT — 18 September 2026
Close 14,500.75, up 78.90 (+0.55%), open 14,458.55, high 14,537.60, low 14,448.55.
An 89.05-point range — the narrowest day of the four indices, narrower even than the Nifty's 102.55 — closed 58.6% of the way up it, which is within three tenths of a percent of where the Nifty finished in its own. On Friday these two did almost exactly the same thing at different scales.
The recovery is where it separates. Its week low of 14,133.30, made on Wednesday, is 367.45 points below Friday's close — a bounce of +2.60%, more than twice any other index on this page:
| Off its weekly low | |
|---|---|
| Sensex | +0.42% |
| Nifty 50 | +1.00% |
| Bank Nifty | +1.01% |
| Nifty Midcap Select | +2.60% |
That leaves it 65.7% of the way up its weekly range, the highest of the four — and yet the week itself is −0.58%, worse than the Nifty's −0.22% and the Bank Nifty's −0.44%. It fell furthest and it recovered furthest, and those two facts land on opposite sides of the ledger. This is the same inversion the 16 September note described, now measured over a full week rather than a session: biggest bounce, still nearly the weakest week.
Where it sits. Between two marked levels and close to both: 14,560.22 is 59.47 above (0.41%), 14,431.69 is 69.06 below (0.48%). That band is only 128.53 points wide and price is 53.7% up it — of the six instruments here this is the tightest pocket, and an 89-point day inside a 129-point band is a market with nothing immediately in front of it either way.
Above, 14,661.31 is 160.56 away (1.11%). Below, 14,330.58 at 170.17 (1.17%) and then 14,121.51, which the Wednesday low of 14,133.30 stopped 11.79 points short of and did not break.
On the weekly chart the rising channel that has carried this index since last year is still intact and price is inside it — the one structure on this page that this week did not damage.
Marked levels. Above 14,560.22 · 14,661.31. Below 14,431.69 · 14,330.58 · 14,121.51 · 13,999.84 · 13,878.16 · 13,703.37.
INDIA VIX — 18 September 2026
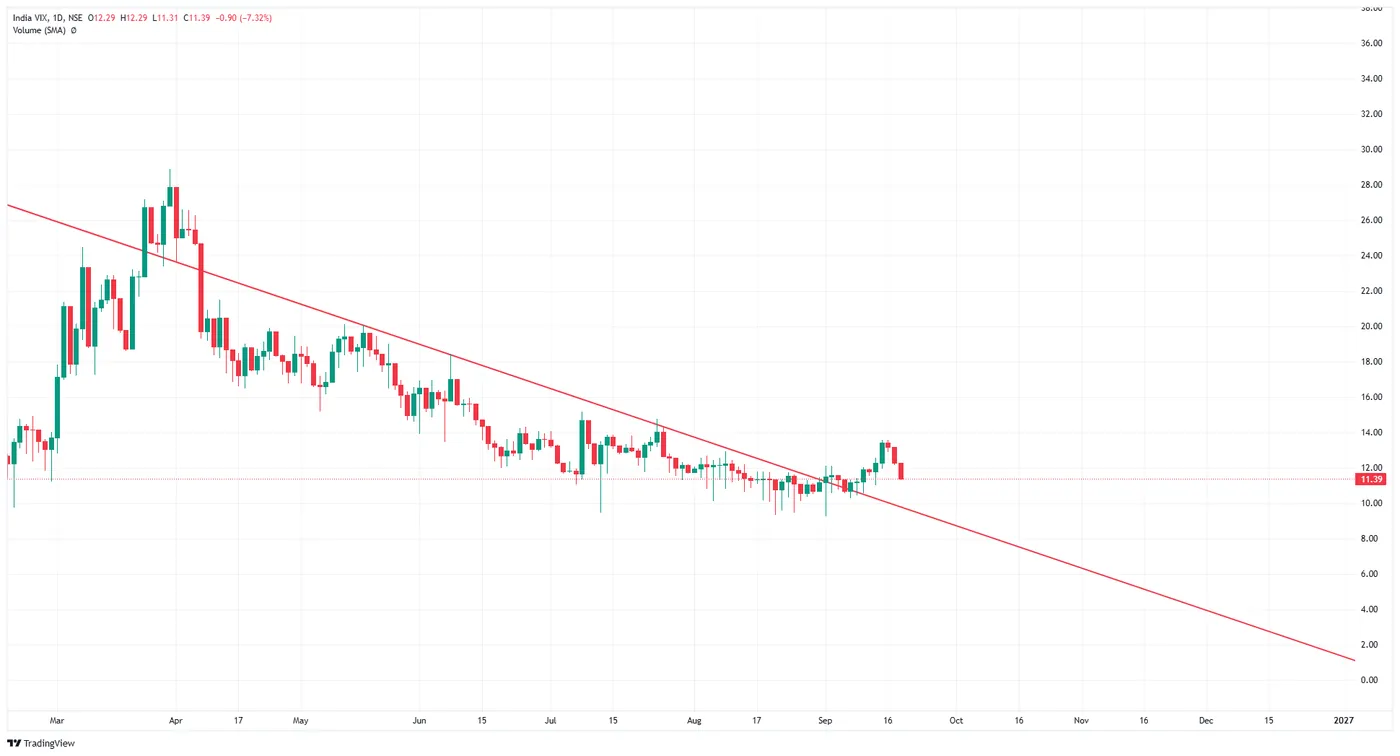
Close 11.39, down 0.90 (−7.32%), open 12.29, high 12.29, low 11.31.
The open, the high and Thursday's close are all 12.29. Volatility never traded above where it finished the day before: it opened at that level, was sold from the first print, and closed 0.08 off its low — 8% of the way up a 0.98-point range. Of the four instruments on this page it is the one that finished furthest toward one end of its own day.
That is the cleanest single statement of what Friday was. The three indices went up, sideways and up; the price of protection fell 7.32%. A quiet 102-point session in the Nifty and a 7% collapse in implied volatility are the same event described twice.
Read against the week, it also says where the fear went. Volatility rose into the midweek selloff and has now given the whole of that rise back — and it has done so faster than the indices have recovered. The Nifty is still 0.22% lower on the week and the Sensex 0.65% lower, but the volatility premium those falls were priced with has gone.
On the daily chart, VIX spent September beneath the falling line drawn off the March highs, pushed above it during the selloff, and has come back to it. The break upward did not hold for a week.
At 11.39 it sits in the lower part of its range for the year — nearer the July lows than anything seen in the spring — which is worth stating as position rather than as prediction: a low reading describes what options cost now, not what the market will do next.
CRUDE OIL (MCX, 21 Sep fut) — 18 September 2026
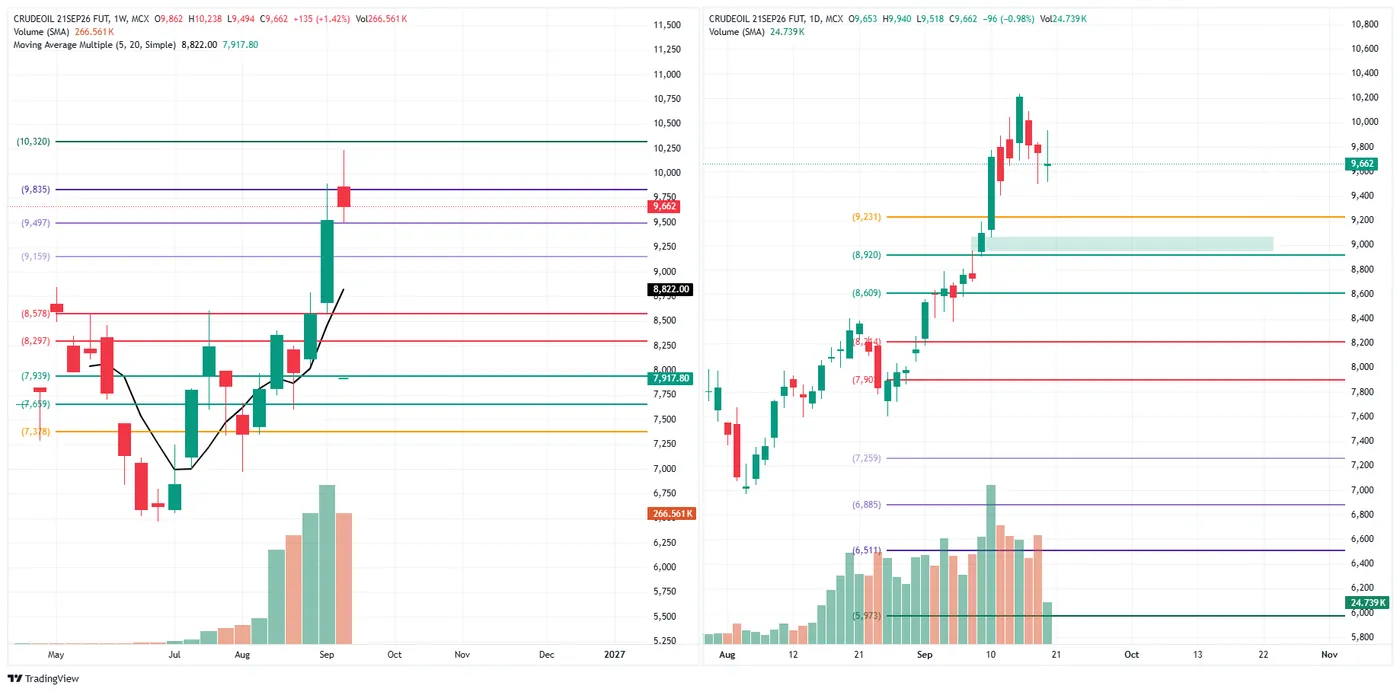
Close 9,662, down 96 (−0.98%), open 9,653, high 9,940, low 9,518. Volume 24.739K.
A 422-point range that ended nine points above its own open — everything that happened inside it was given back. The close sits 34% of the way up that range, the lowest position of anything on this page except the Sensex.
Three consecutive down sessions now. From Tuesday's close the contract has lost 553 points (−5.41%), and from the weekly high of 10,238 it is 576 lower (−5.63%):
| Close | |
|---|---|
| 15 Sep | 10,215 |
| 16 Sep | 9,816 |
| 17 Sep | 9,758 |
| 18 Sep | 9,662 |
The week, finished. Open 9,862, high 10,238, low 9,494, close 9,662 — up 135 (+1.42%) against the prior week's 9,527. It stood at +3.03% on Wednesday, so more than half the week's gain went in two sessions, and the 7.22% the move showed at Tuesday's close is now less than a fifth of that.
The close is 22.6% of the way up its weekly range, which puts crude next to the Sensex at the bottom of this page — the two weakest weekly closes of the six, and the only two under 25%.
The averages disagree, and the timeframe is the reason. On the daily, price is 171 below the 5-day (9,833.00) and 795 above the 20-day (8,866.55). On the weekly it is above both — 840 over the 5-week (8,822.00) and 1,744 over the 20-week (7,917.80), 8.69% and 18.05% clear. So the damage is entirely short-term: three down sessions have taken price under its fast daily average while leaving the weekly structure untouched and a long way above its own.
Note the volume. 62.053K on Tuesday, 50.835K on Wednesday, 24.739K on Friday — under 40% of Tuesday's. This is the 21 September contract and it expires on Monday, so the decline is mostly the roll rather than a verdict: open interest is leaving this contract because it has to. Read the last few sessions' volume on this chart as a contract emptying out, not as conviction draining from crude.
Where it sits. The daily chart carries no marked level above price at all — the nearest, 9,231, is 431 below (4.46%). The weekly chart does, and it puts the close in a narrow pocket: 9,835 is 173 above (1.79%) and 9,497 is 165 below (1.71%). Price is sitting 48.8% of the way up a 338-point band, almost exactly between the two. Above that pocket, 10,320 — the level the spike high of 10,238 stopped 82 short of on Tuesday — is 658 away (6.81%).
Marked levels. Above 9,835 · 10,320. Below 9,497 · 9,231 · 9,159 · 8,920 · 8,609 · 8,578 · 8,297 · 7,939 · 7,659 · 7,378 · 7,259 · 6,885 · 6,511 · 5,973.
GOLD (MCX, 5 Oct fut) — 18 September 2026
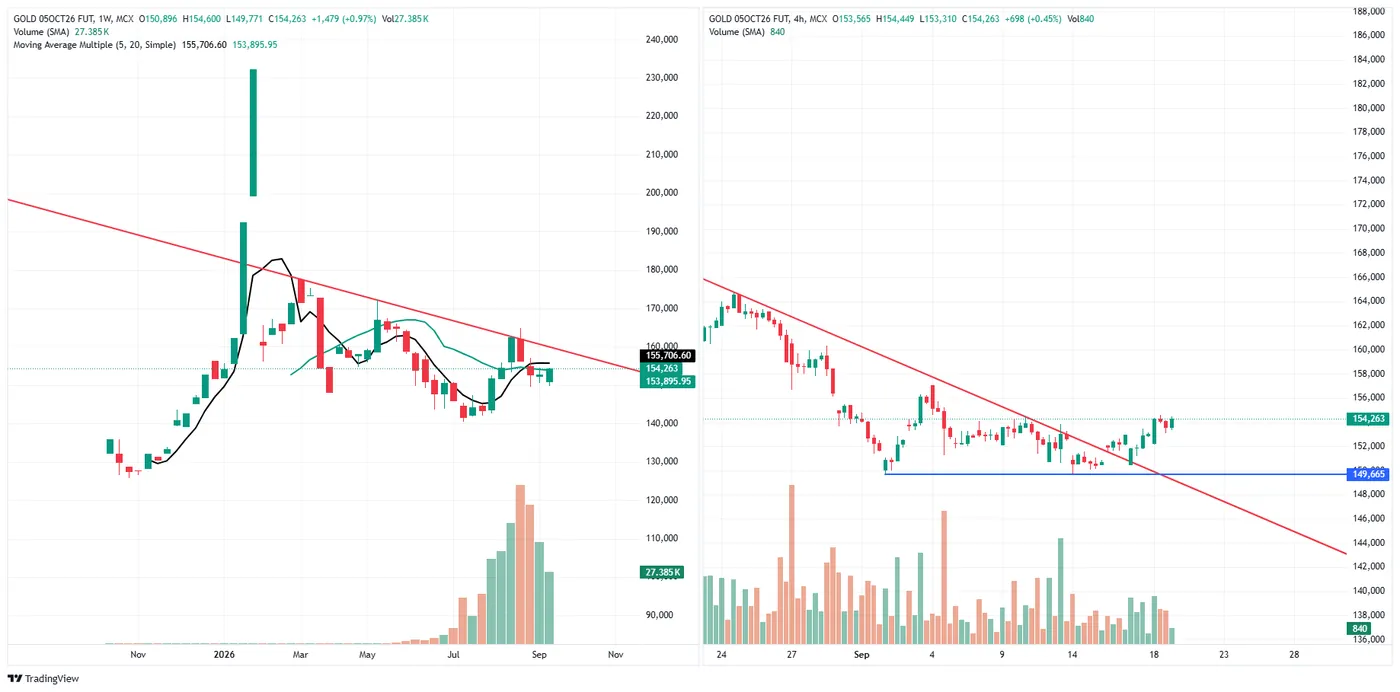
Week close 154,263, up 1,479 (+0.97%), from a weekly open of 150,896, a high of 154,600 and a low of 149,771. On the 4-hour, the final bar closed 154,263, up 698 (+0.45%), high 154,449, low 153,310.
Gold finished 93% of the way up its weekly range — 4,492 points off the week's low of 149,771, and only 337 below its high. That is by a distance the strongest weekly close position on this page:
| Up its weekly range | |
|---|---|
| Sensex | 21.6% |
| Bank Nifty | 46.9% |
| Nifty 50 | 48.3% |
| Gold | 93.0% |
It is also the only instrument here that is up on the week by a full percent while three of the four equity indices are down.
The averages have closed on each other. Price sits 1,443.60 below the 5-week (155,706.60) and 367.05 above the 20-week (153,895.95) — inside them both, and those two averages are only 1,810.65 apart, 1.17% of price. Crude is in the same configuration but nothing like as tight: 1.77% below its fast average and 8.23% above its slow one. For gold the fast and slow readings have nearly converged, which is what a long sideways range does to them; it describes compression, not direction.
Two trendlines, two answers. On the weekly chart price is still beneath the falling line drawn off the spike high — the line that has capped every rally since. On the 4-hour, price has pushed above the shorter falling line drawn off the late-August high and held above it into the close. The short-term cap has gone; the long-term one has not been reached.
Continuing Wednesday's note: gold closed at 152,950 then, which was both that day's high and that week's high. It has since added 1,313 (+0.86%) and taken the weekly high 1,650 higher. The half-retracement at 153,365 that it stopped 415 short of on Wednesday is now 898 below price — cleared, and the next mark on that scale, 156,057, is 1,794 above (1.16%).
On the 4-hour the blue horizontal at 149,665 sits 4,598 below (2.98%); it is the floor the early-September base was built on and it was not revisited this week.
Read across the week
Four sessions, three indices, and they did not do the same thing.
| Friday | Closed in its range | Week | Up its weekly range | Weekly low made | |
|---|---|---|---|---|---|
| Nifty 50 | +0.33% | 58% | −0.22% | 48.3% | Wed 16th |
| Sensex | −0.03% | 0% | −0.65% | 21.6% | Wed 16th |
| Bank Nifty | +0.54% | 67% | −0.44% | 46.9% | Tue 15th |
Two separations are worth keeping apart.
By index. The Nifty and the Bank Nifty finished the week in nearly the same place relative to their own ranges — 48.3% and 46.9% — while the Sensex is at half that. The Sensex is the outlier of the three this week, and it was the Sensex, not the midcap index, that ended weakest; the order from last week has changed.
By day. Friday itself was quiet everywhere except in where it left prices. The Bank Nifty and the Nifty closed in the upper half of their ranges, the Sensex at the very bottom of its. Two of the three held their short-term rising lines into the close and the Sensex broke its.
The Bank Nifty is also the only one of the three whose low is now three sessions old rather than two — it stopped falling on Tuesday while the other two made a fresh low on Wednesday.
And the volatility side agrees with the calmer reading, not the weaker one. India VIX fell 7.32% on Friday to 11.39, opening at Thursday's close and never trading above it. Two of the three indices closed up, one closed on its low, and the price of protection came off hard in all of it. The index that ended weakest is the one whose 15-minute structure broke; the volatility market priced the week as finishing calm regardless.
Crude went the other way all week and is still going. It fell for a third straight session to 9,662, has given back more than half of a weekly gain that stood at +3.03% on Wednesday, and closed 34% up its range while the equities closed at 58% and 67%. Last week the commodities moved apart from the indices and from each other; this week crude has simply been falling while the indices recovered — though with its contract expiring Monday, the thinning volume on its chart is the roll and not a signal.
Gold did the opposite of crude and of the indices. Ranking all five by where each finished inside its own weekly range:
| Up its weekly range | Week | |
|---|---|---|
| Sensex | 21.6% | −0.65% |
| Crude oil | 22.6% | +1.42% |
| Bank Nifty | 46.9% | −0.44% |
| Nifty 50 | 48.3% | −0.22% |
| Nifty Midcap Select | 65.7% | −0.58% |
| Gold | 93.0% | +0.97% |
Two rows in that table say something the weekly percentage on its own does not.
Crude finished in almost the same place as the Sensex — 22.6% against 21.6% — despite being up 1.42% while the Sensex was down 0.65%. It gained on the week and still closed near the bottom of it, because the whole gain was made and mostly surrendered inside the same five days.
The midcap index is the mirror of that. It sits 65.7% up its weekly range, higher than both large caps, while finishing −0.58% — worse than either of them. It fell furthest and recovered furthest; the range position records the recovery and the weekly change records the fall.
Between them, the Nifty and the Bank Nifty are the only two whose weekly change and range position tell the same story. Gold is alone at the top, the only instrument here to close its week near its high.
The two commodities have separated completely — crude three sessions into giving back a spike, gold pressing the top of its range — and they are now the two extremes of this page rather than a pair.
What the institutional flow did
The week's four sessions were not one behaviour here either. They divide cleanly:
| FII net | DII net | Net of the two | DII cover | |
|---|---|---|---|---|
| 15 Sep | −₹2,977.86 Cr | +₹2,686.05 Cr | −₹291.81 Cr | 0.90× |
| 16 Sep | −₹2,032.61 Cr | +₹3,908.23 Cr | +₹1,875.62 Cr | 1.92× |
| 17 Sep | −₹3,208.76 Cr | +₹3,617.75 Cr | +₹408.99 Cr | 1.13× |
| 18 Sep | +₹599.54 Cr | +₹1,019.69 Cr | +₹1,619.23 Cr | — |
Two things in that table are worth separating.
17 September was the heaviest day of foreign selling in September — ₹3,208.76 Cr, larger than the 4th's ₹3,111.94 Cr — and domestic buying covered it only 1.13 times, against 1.92 the day before.
18 September was the first day this month since the 7th on which FII were net buyers. Four consecutive selling sessions — the 11th, 15th, 16th and 17th — ended with a ₹599.54 Cr purchase. It is a small number against what preceded it; the point is the sign, not the size. Domestic buying also fell back sharply on Friday, to ₹1,019.69 Cr from ₹3,617.75 Cr, which is the other half of why the day was so quiet: both sides stepped back at once.
Derivatives cut the other way
FII positioning across index futures, index options, stock futures and stock options, Thursday to Friday:
| 17 Sep | 18 Sep | Change | |
|---|---|---|---|
| Index futures | −290,041 | −288,428 | +1,613 |
| Index options | −895,602 | −898,855 | −3,253 |
| Stock futures | +539,565 | +500,795 | −38,770 |
| Stock options | −457,982 | −479,193 | −21,211 |
| Net | −1,104,060 | −1,165,681 | −61,621 |
So on the day FII bought cash, their derivatives book went more short by 61,621 contracts — almost all of it from cutting the one net-long position, stock futures, and adding stock-options shorts. Index futures moved the other way, slightly less short.
Across the week the direction reverses again: the net short stood at 1,223,851 contracts on Tuesday and 1,165,681 on Friday, 58,170 contracts less short than where the week began. A position trimmed over four days and added to on the last of them is not a single stance, and reading either day as the week's view would be reading it wrong.
Three limits, unchanged. These are net figures across all participants in a category, so they describe an aggregate and not any one desk. Four sessions is a week, not a trend. And flow published after the close cannot have caused the candles that produced it — the two are measured independently, which is what makes it worth putting them side by side at all.
Descriptive commentary on price structure and marked levels. It is not advice, not a recommendation, and contains no targets or entry levels. NEOGreeks is not a SEBI-registered investment adviser.