NIFTY 50 — 16 September 2026
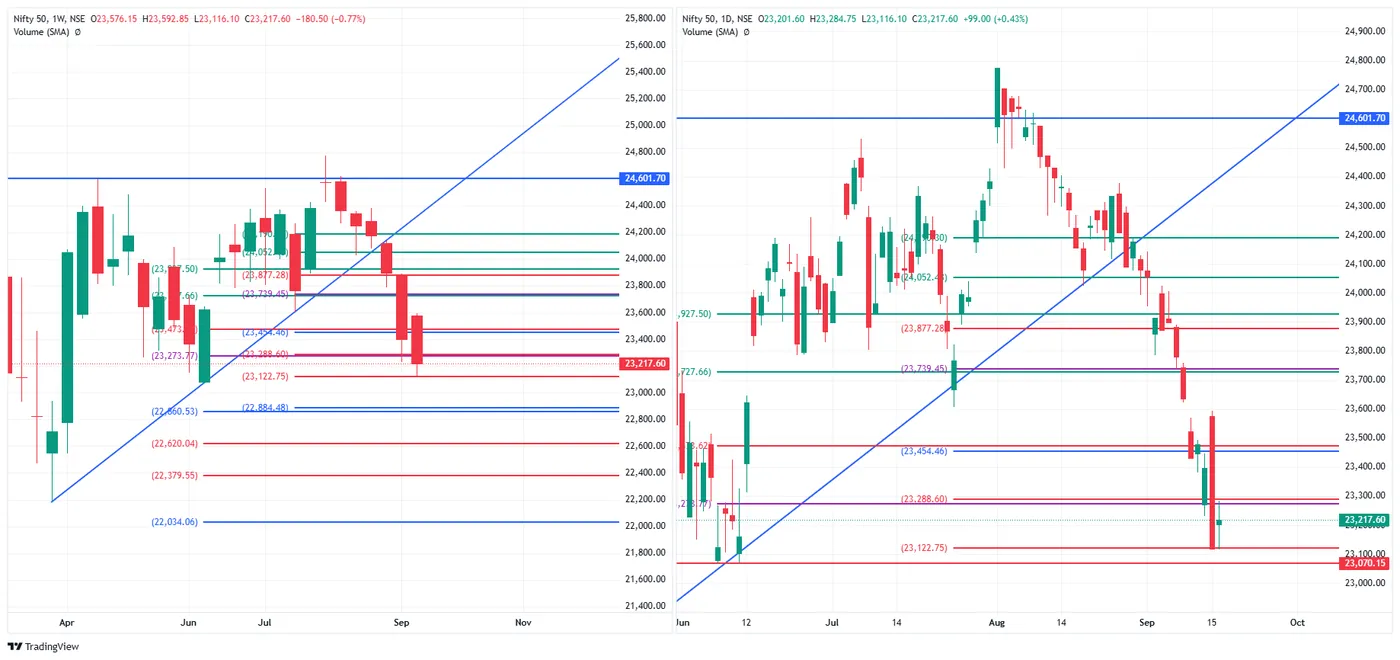
Close 23,217.60, up 99.00 (+0.43%), from an open of 23,201.60, a high of 23,284.75 and a low of 23,116.10.
Yesterday closed on its low at 23,118.60 with no recovery at all. Today opened 83 points above that, then went below it — the low of 23,116.10 is a new low for the week — and spent the rest of the session working back up. The close is 101.50 above the low and sits about 60% of the way up the day's range.
That matters against 23,122.75. Yesterday price finished beneath it. Today the low pierced it by under seven points and the close is back above — the level was tested from below and reclaimed inside one session, which is a different outcome from yesterday's, where nothing was reclaimed.
The day's high stopped at 23,284.75, 3.85 points short of 23,288.60. The next mark above was reached and not taken.
The week is two sessions old and stands at −0.77%, narrower than the −1.19% it showed at last night's close. The rising line from the April low remains broken and nothing today tested it; 24,601.70 is unchanged overhead.
Marked levels. Above 23,288.60 · 23,454.46 · 23,739.45 · 23,877.28. Below 23,122.75, then 22,884.48 with nothing marked between.
SENSEX — 16 September 2026
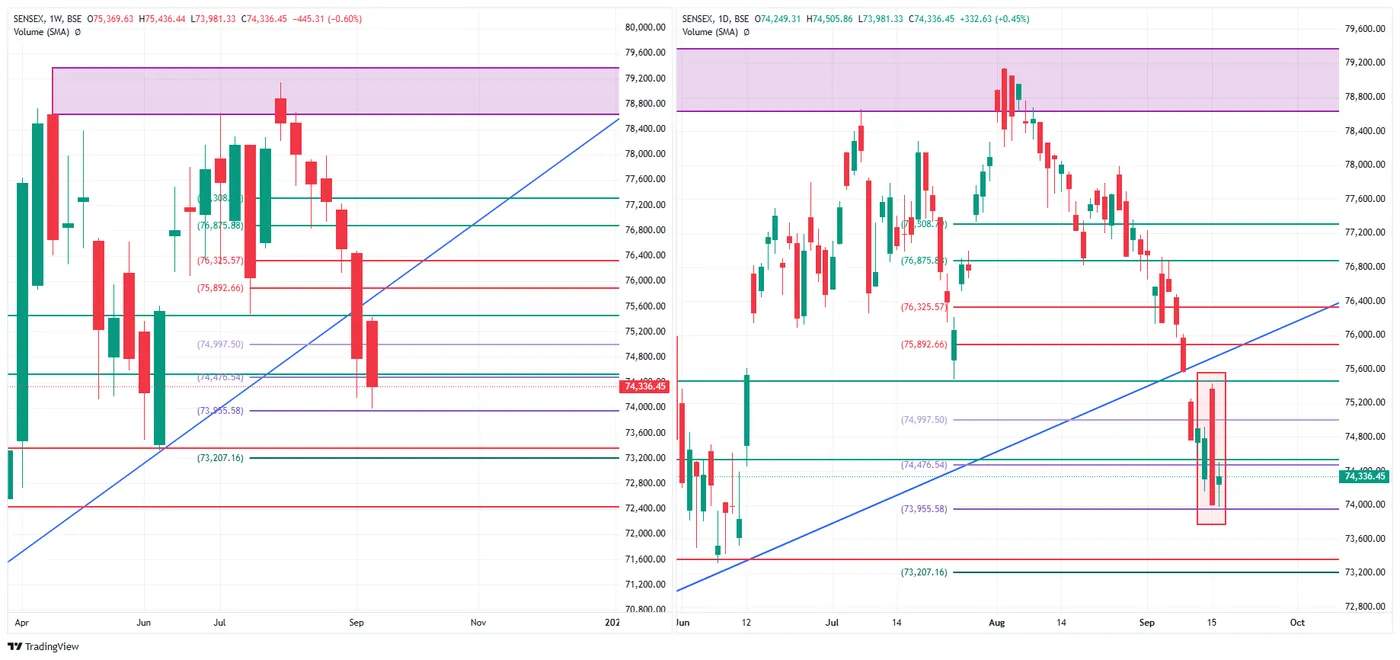
Close 74,336.45, up 332.63 (+0.45%), open 74,249.31, high 74,505.86, low 73,981.33.
The same shape as the Nifty, and slightly stronger: the low undercut both yesterday's close and yesterday's low, and the close finished 355 points above it, about 68% of the way up the range.
Two levels did work today. 73,955.58 was tested and held — the low stopped 25.75 points above it. And 74,476.54, which the index lost yesterday, was retaken intraday at the high of 74,505.86 and then given back; the close of 74,336.45 is beneath it again. So the floor held and the ceiling did not break.
The week stands at −0.60%, from −1.04% last night.
Marked levels. Above 74,476.54 · 74,997.50 · 75,892.66 · 76,325.57. Below 73,955.58 · 73,207.16 · 72,437.43.
BANK NIFTY — 16 September 2026
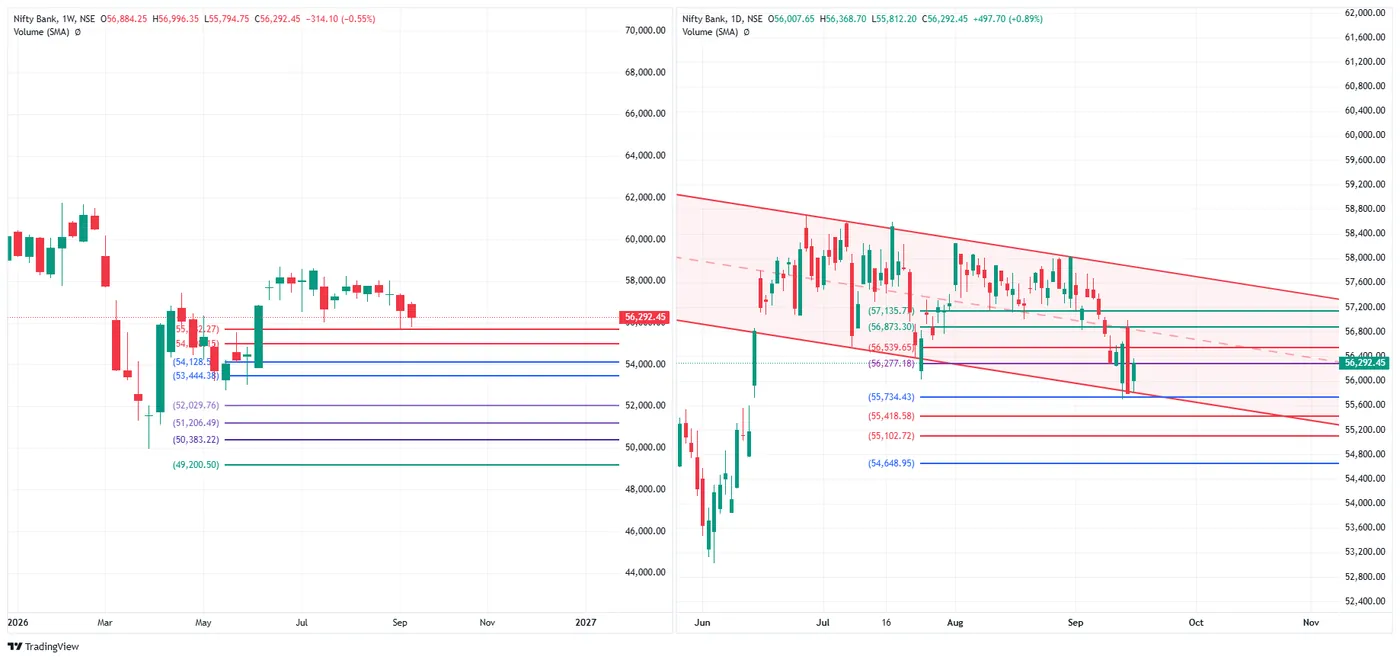
Close 56,292.45, up 497.70 (+0.89%) — the largest gain of the four — open 56,007.65, high 56,368.70, low 55,812.20.
The only one of the four that did not make a new low. Its low of 55,812.20 held 17.45 points above yesterday's close, and 77.77 above the marked 55,734.43. It is also the strongest close of the four in its own range, at about 86% of it — the other three finished in the 60s.
56,277.18, which yesterday's close sat beneath, has been reclaimed: the close is 15.27 points above it. 56,539.65 is the next mark and was not reached.
The structure has not changed, and this is the caution that carried over from last Friday: the bounce is happening inside a channel whose boundaries still slope down. A higher low inside a descending channel is still a higher low inside a descending channel.
The week stands at −0.55%, the shallowest of the four.
Marked levels. Above 56,539.65 · 56,873.30 · 57,135.71. Below 55,734.43 · 55,418.58 · 55,102.72 · 54,648.95.
NIFTY MIDCAP SELECT — 16 September 2026
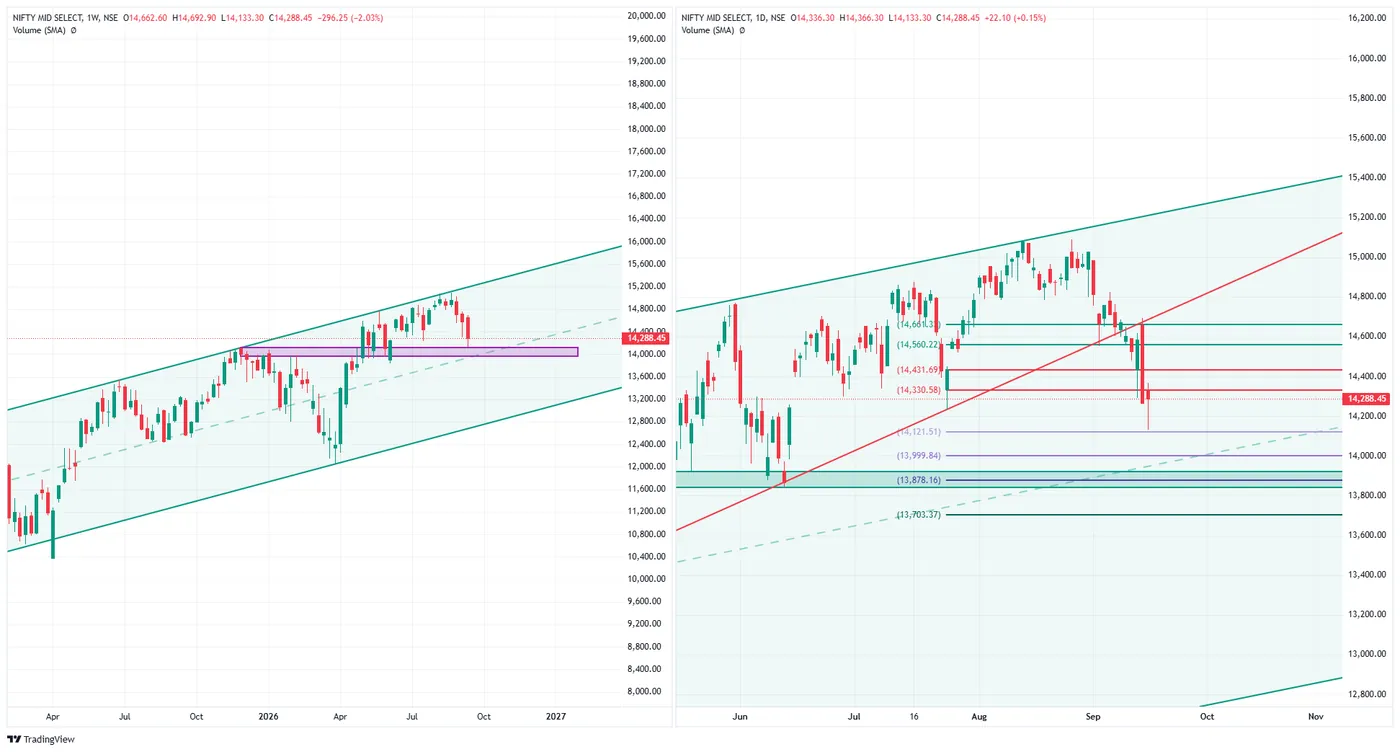
Close 14,288.45, up just 22.10 (+0.15%) — the smallest gain of the four — open 14,336.30, high 14,366.30, low 14,133.30.
This one is worth reading carefully, because the day change understates what happened inside it. The index opened 70 points up, sold off 203 points to 14,133.30, and then recovered 155.15 — the largest bounce off the low of the four, at +1.10% — yet still finished barely green, because it had further to climb back. Biggest recovery, smallest gain: both are true of the same session.
14,121.51 held, by 11.79 points. Above, 14,330.58 was exceeded at the high and not held into the close.
The week stands at −2.03%, still more than three times the Bank Nifty's fall and the worst of the four for the second week running.
Marked levels. Above 14,330.58 · 14,431.69 · 14,560.22 · 14,661.31. Below 14,121.51 · 13,999.84 · 13,878.16 · 13,703.37.
CRUDE OIL (MCX, 21 Sep fut) — 16 September 2026
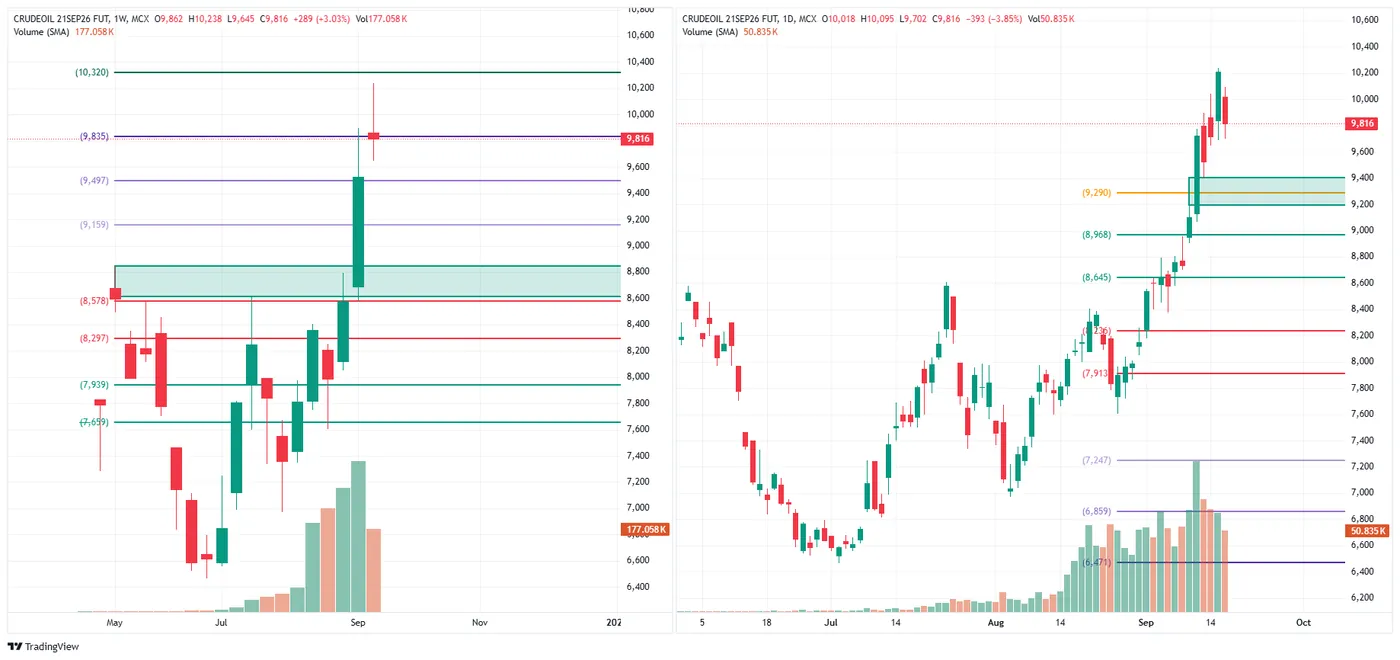
Close 9,816, down 393 (−3.85%) on the day — open 10,018, high 10,095, low 9,702. Volume 50.8K against yesterday's 62.1K.
Yesterday this rose 5.13% on the day and 7.22% on the week on the heaviest volume visible on its chart. Today it gave a large part of that back in one session. The range ran 393 points, from 10,095 down to 9,702, and the close of 9,816 sits 114 above the low and 279 below the high — about 29% of the way up its own range.
That is the number worth holding against the equities. The four indices closed between 60% and 86% of the way up their ranges today; crude closed in the bottom third of its. They recovered into the close and it did not.
The week is still +3.03%, so the move is not undone — but the weekly high of 10,238 now stands from yesterday's session rather than today's, and 10,320, which was about 1% overhead last night, was not approached.
The close of 9,816 sits just under 9,835, by 19 points.
Marked levels. Above 9,835 · 10,320. Below 9,497 · 9,159 · 8,968 · 8,645.
GOLD (MCX, 5 Oct fut) — 16 September 2026
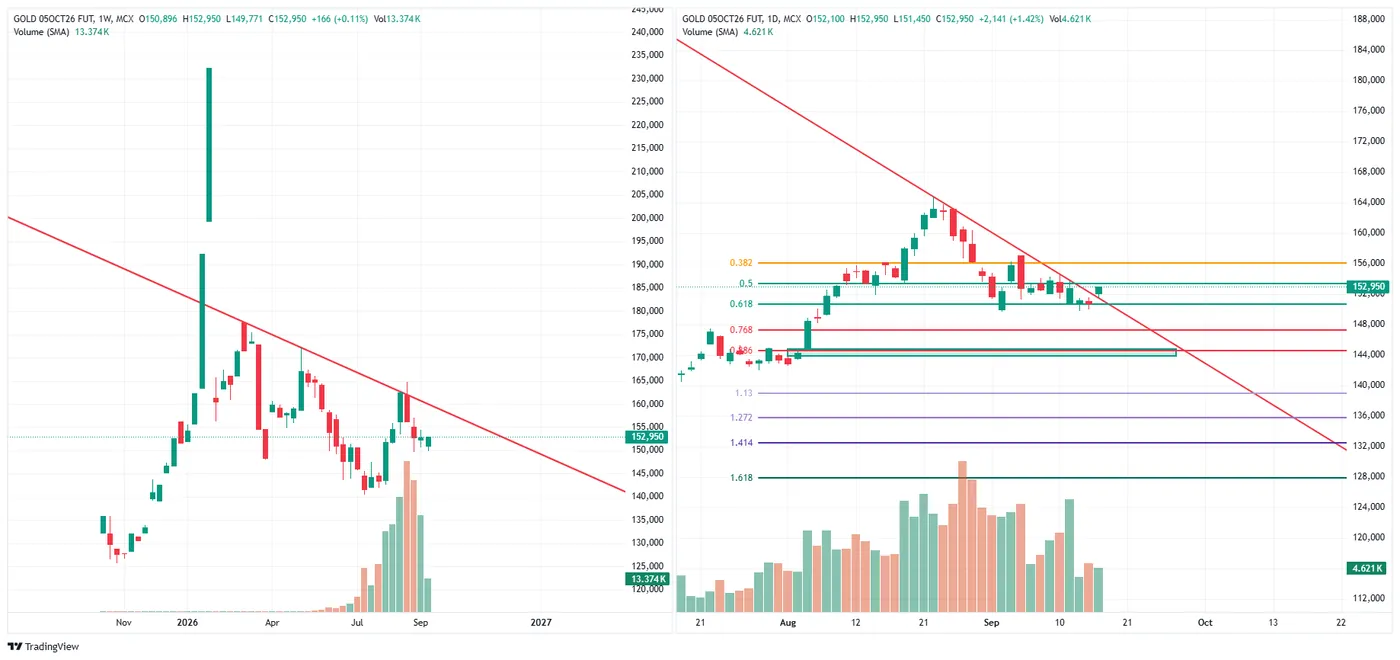
Close 152,950, up 2,141 (+1.42%) on the day, open 152,100, high 152,950, low 151,450.
The close is the high — and it is also the high of the week. That is the exact inverse of what the equity indices did yesterday, and it is the only one of today's six charts that finished at an extreme of its own range rather than somewhere in the middle of it.
The close stops just beneath the half-retracement of the decline off the spike high — 153,365, marked 0.5 on the chart — finishing 415 points short of it. Below, the nearest mark is 150,672 (0.618), which the week's low of 149,771 traded through before this recovery.
On the week gold is +0.11%, essentially flat, which is the more useful number: today's gain reverses last week's loss rather than adding to anything. Price is also still beneath the descending line that has capped every rally on the weekly chart since the spike high — the close at its own daily high is happening underneath a line that has not yet been broken.
Marked levels, shown on the chart as retracement ratios of that decline. Above 153,365 (0.5) · 156,057 (0.382). Below 150,672 (0.618) · 147,250 (0.768) · 144,867 (0.886) · 138,990 · 135,750 · 132,510 · 127,855.
Read across the session
Yesterday all four equity indices closed on their lows with no recovery in any of them. Today all four closed up, and three of them did it after first making a new low for the week.
| 15 Sep | 16 Sep | Low today | Bounce off low | Close in range | |
|---|---|---|---|---|---|
| Nifty 50 | −1.19% | +0.43% | new low | +0.44% | 60% |
| Sensex | −1.04% | +0.45% | new low | +0.48% | 68% |
| Bank Nifty | −1.43% | +0.89% | held | +0.86% | 86% |
| Nifty Midcap Select | −2.18% | +0.15% | new low | +1.10% | 67% |
Two different things are being measured in those last two columns and they do not agree. The midcap index bounced hardest off its low and still finished nearly flat, because it fell furthest first. Bank Nifty bounced less in percentage terms but was the only index that never went below yesterday, and it closed nearest the top of its range. On the day's change Bank Nifty is the strongest and the midcap the weakest; on the recovery from the low the order inverts.
The week, two sessions in, has them at −0.55%, −0.60%, −0.77% and −2.03%. The midcap index remains the outlier it has been since the 15th.
The commodities moved apart from the indices and from each other: crude gave back a large part of a 7.22% weekly gain, while gold closed at its high. Yesterday the four equity indices moved as one and the commodities did not move with them. Today the equities moved together again, and the two commodities moved in opposite directions.
What the institutional cash flow did
| FII net | DII net | Net of the two | DII cover of FII selling | |
|---|---|---|---|---|
| 11 Sep | −₹930.90 Cr | +₹1,968.17 Cr | +₹1,037.27 Cr | 2.11× |
| 15 Sep | −₹2,977.86 Cr | +₹2,686.05 Cr | −₹291.81 Cr | 0.90× |
| 16 Sep | −₹2,032.61 Cr | +₹3,908.23 Cr | +₹1,875.62 Cr | 1.92× |
The pattern that held on the 11th and broke on the 15th is back. On both days where domestic buying exceeded foreign selling, every index closed off its low; on the one day this month where it did not, every index closed on its low.
Today's ₹3,908.23 Cr of domestic buying is the third largest single day in September, behind only the 3rd and the 4th. The net of ₹1,875.62 Cr is the largest since 4 September. Foreign selling continued — ₹2,032.61 Cr, a second consecutive heavy day — but it was absorbed roughly twice over.
Three limits on reading this, unchanged from the last note. These are net figures across all participants in a category, so they describe an aggregate and not any one desk. Three sessions is a pattern observed, not a rule. And flow published after the close cannot have caused the candles that produced it — the two agreeing is worth noting precisely because they are measured independently, not because one explains the other.
The derivatives positioning for today has not been published yet; at the 15th FII stood 1,223,851 contracts net short across index futures, index options, stock futures and stock options, having added 71,507 contracts of short between the 11th and the 15th.
Descriptive commentary on price structure and marked levels. It is not advice, not a recommendation, and contains no targets or entry levels. NEOGreeks is not a SEBI-registered investment adviser.