NIFTY 50 — 15 September 2026
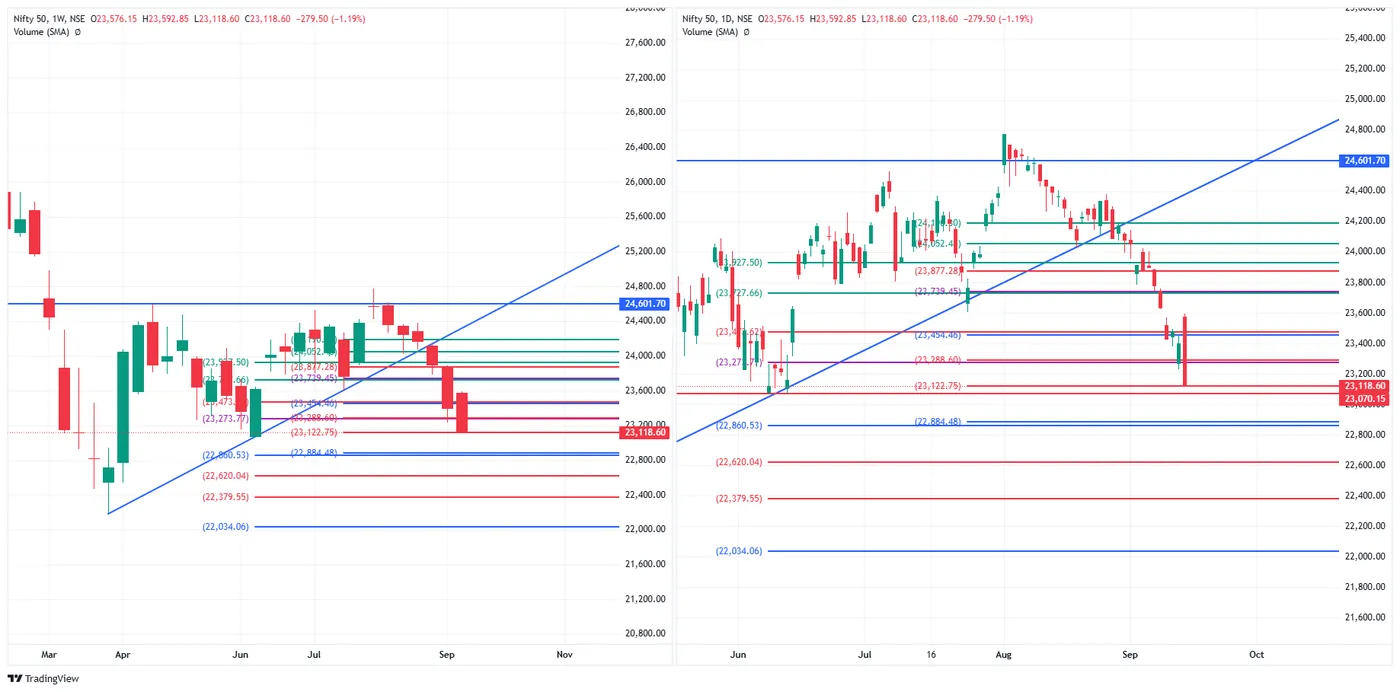
Close 23,118.60, down 279.50 (−1.19%). The session opened 23,576.15, made its high at 23,592.85 and closed on its low — close and low are the same number.
That matters against Friday. The 11th gapped lower and was bought back, closing above its own open. This did the opposite: no recovery at all, the whole range given up, and a finish at the bottom of it. Friday's low of 23,231.40 — the one the close had recovered back above — has now gone, and price is beneath 23,122.75 as well.
Both weekly figures equal the daily ones, so the week is one session old and already down 1.19%.
The rising line from the April low stays broken; nothing here tested it. 24,601.70 is unchanged overhead, now about 6.4% away.
Marked levels. Above 23,122.75 · 23,288.60 · 23,454.46 · 23,739.45 · 23,877.28. Below, the next is 22,884.48 — roughly 234 points, with nothing marked between.
SENSEX — 15 September 2026
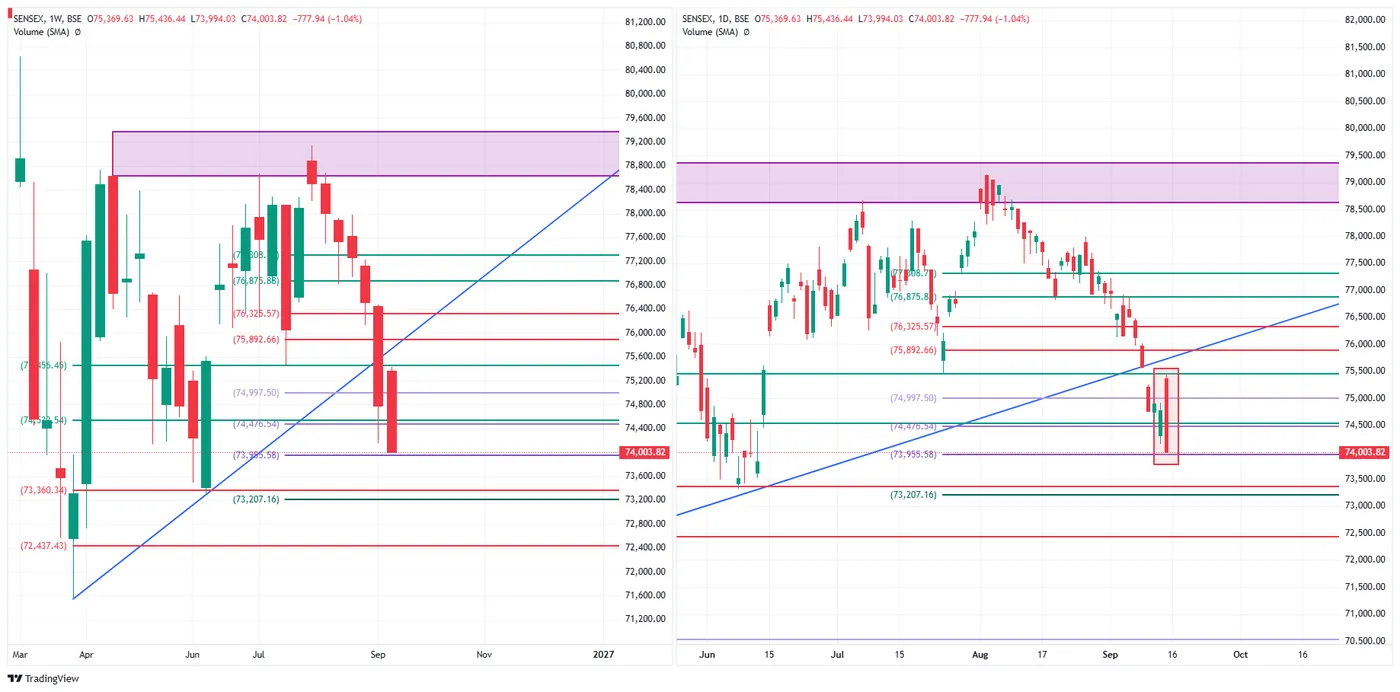
Close 74,003.82, down 777.94 (−1.04%), from an open of 75,369.63 and a high of 75,436.44 against a low of 73,994.03.
The close is about ten points off the low, so the same shape as the Nifty: a session that opened at the top of its range and ended at the bottom. It has gone through 74,476.54, which Friday's close was sitting above, and is now holding 73,955.58 by a whisker — 48.24 points above it, with the low of 73,994.03 only 38.45 clear.
Its −1.04% is the smallest fall of the four indices today, which reverses last week's order — the Sensex was the weakest index over the week to the 11th.
Marked levels. Above 74,476.54 · 74,997.50 · 75,892.66 · 76,325.57. Below 73,955.58 · 73,207.16 · 72,437.43.
BANK NIFTY — 15 September 2026
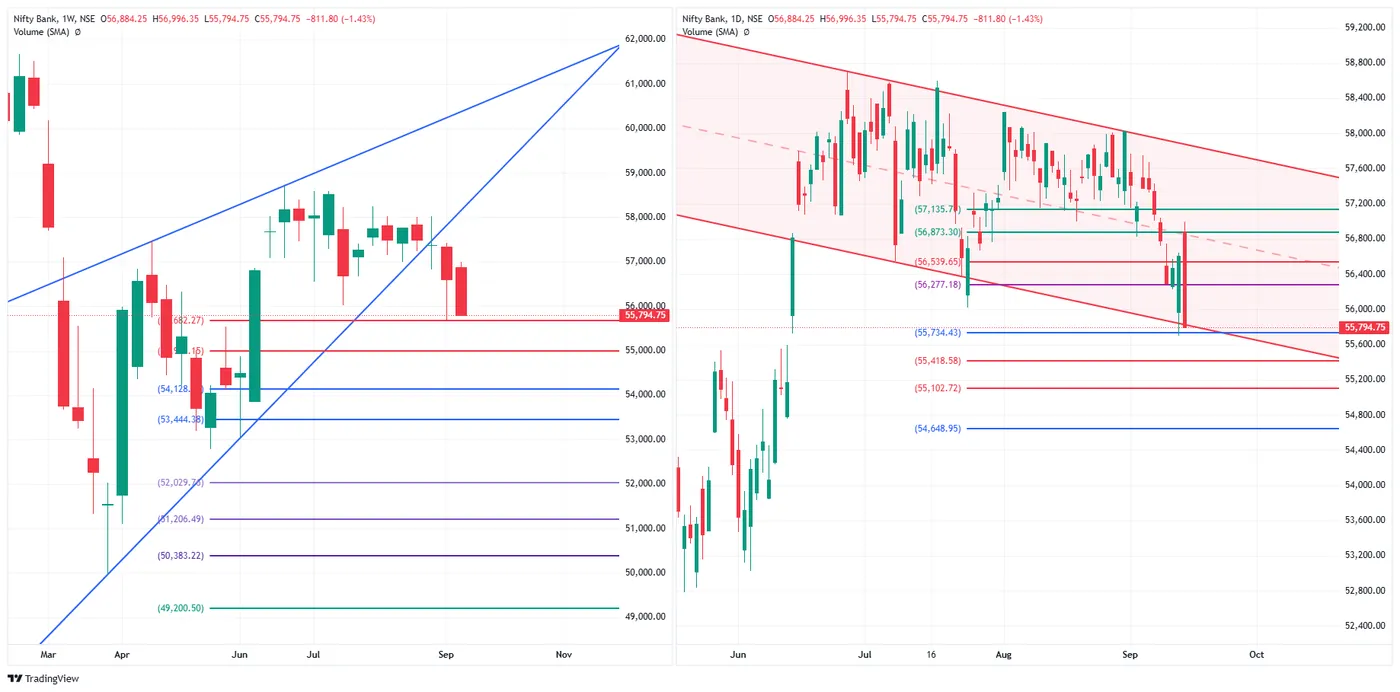
Close 55,794.75, down 811.80 (−1.43%), open 56,884.25, high 56,996.35, and again a close on the low.
Friday's 907-point recovery off the low — the largest of the four — has been fully given back and then some: that low was 55,699.45, and today's close at 55,794.75 sits just 95 points above it.
Structurally this is the one to watch. Price has worked down to the lower boundary of the descending channel it has been inside since the June highs, and the close is now beneath 56,277.18 and 56,539.65, with 55,734.43 about 60 points below.
Marked levels. Above 56,277.18 · 56,539.65 · 56,873.30 · 57,135.7. Below 55,734.43 · 55,418.58 · 55,102.72 · 54,648.95.
NIFTY MIDCAP SELECT — 15 September 2026
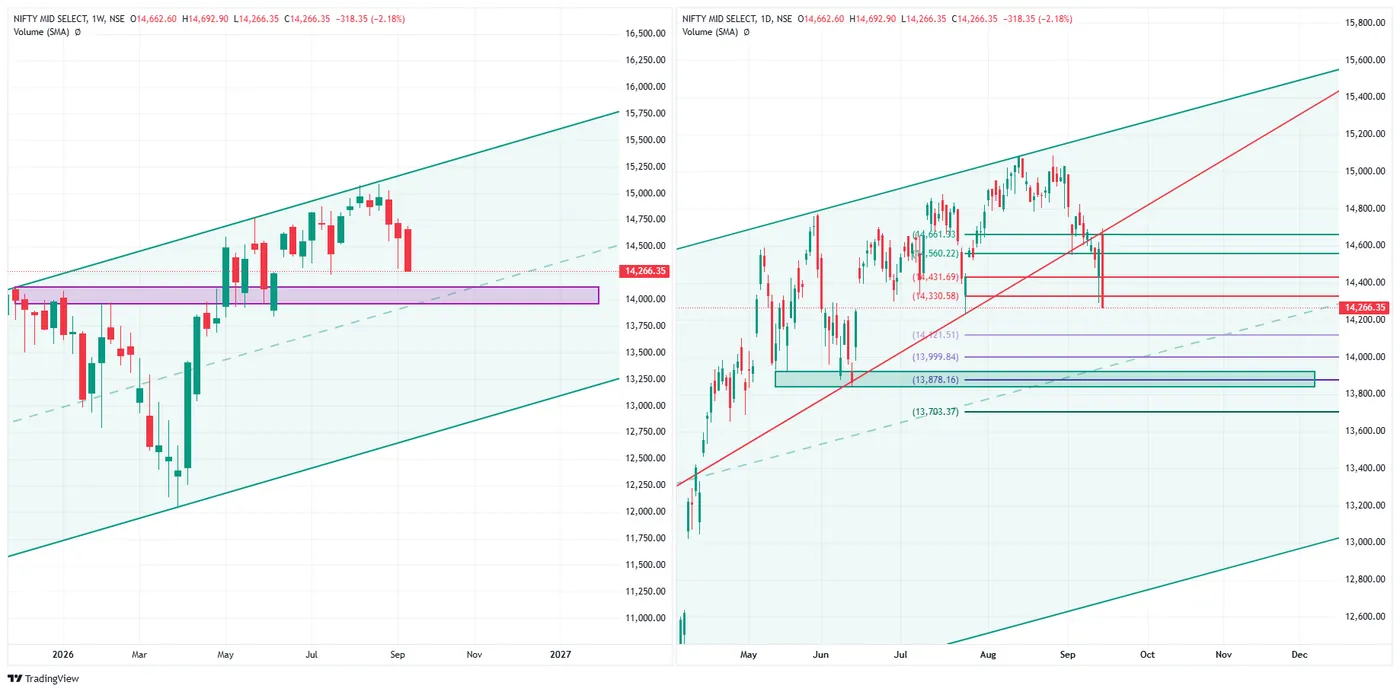
Close 14,266.35, down 318.35 (−2.18%) — the largest fall of the four, and close on the low again.
This is a straight reversal of Friday, when it was the strongest of the four (+0.39%) and the only one with an intact structure. It has cut through both 14,431.69 and 14,330.58 in one session, and Friday's low of 14,292.05 has gone.
The rising channel is still drawn on the chart, but price has dropped to around its dashed median rather than sitting in the upper half where it was on Friday. The weekly purple band at roughly 13,980–14,100 is now the nearest structure beneath.
Marked levels. Above 14,330.58 · 14,431.69 · 14,560.22 · 14,661.33. Below 14,121.51 · 13,999.84 · 13,878.16 · 13,703.37.
CRUDE OIL (MCX, 21 Sep fut) — 15 September 2026
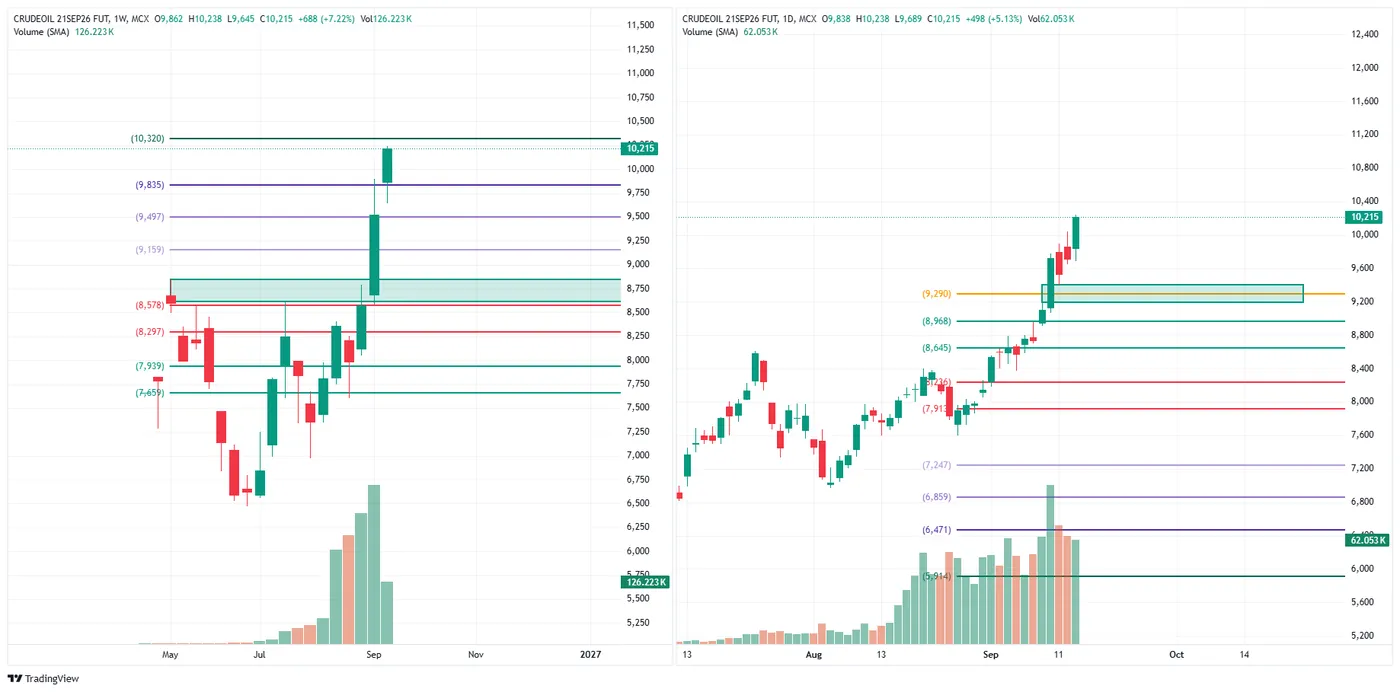
Close 10,215, up 498 (+5.13%) on the day and +688 (+7.22%) on the week — against four equity indices that all fell.
Volume is the part worth stating plainly: 62,053 contracts on the day against a weekly 126,223, and the daily volume bars are the tallest on the visible chart by a wide margin. This was not a quiet drift higher.
Price has run from roughly 8,500 in late August to 10,215, clearing the 8,645 · 8,968 marks, the shaded 9,290 band, and then 9,497 and 9,835 in succession. 10,320 is the first mark above and is about 1% away; the close is the highest point on the chart.
Marked levels. Above 10,320. Below 9,835 · 9,497 · 9,159 · 8,968 · 8,645 · 7,913 · 7,247 · 6,859 · 6,471 · 5,914.
GOLD (MCX, 5 Oct fut) — 15 September 2026
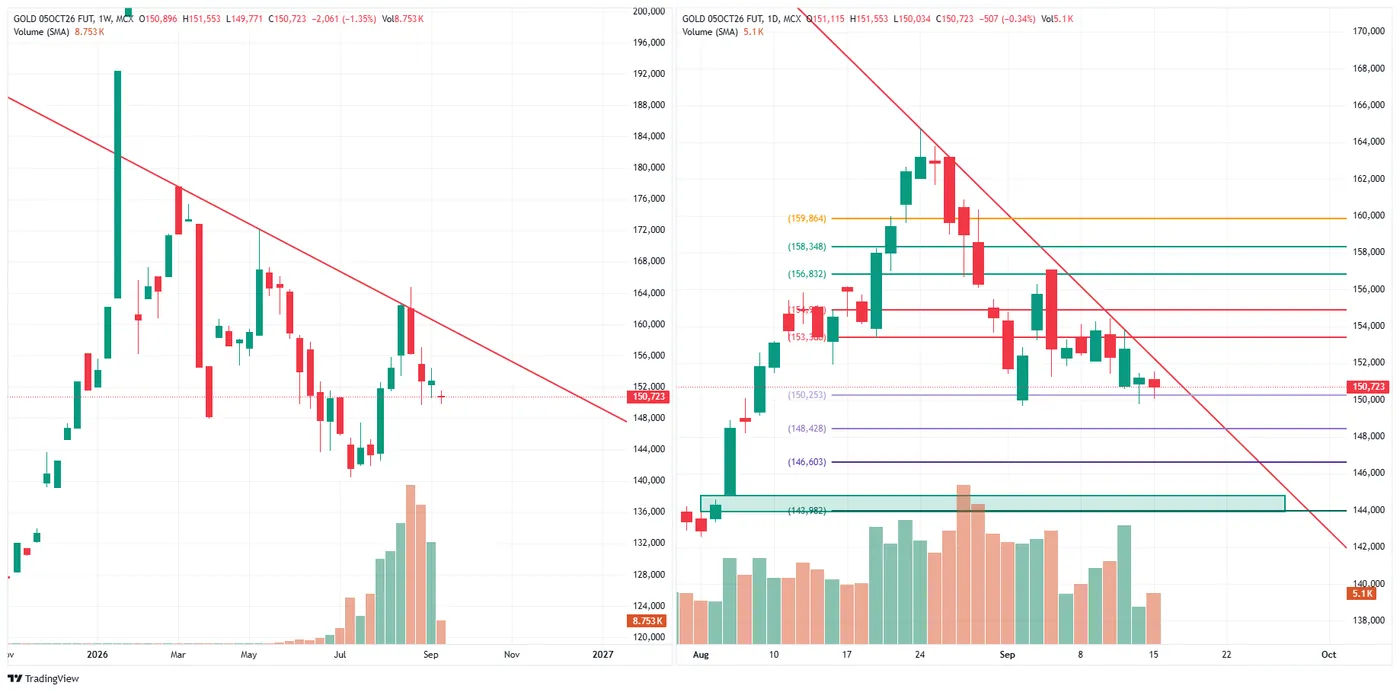
Close 150,723, down 507 (−0.34%) on the day and 2,061 (−1.35%) on the week.
The descending line off the January high is still overhead and price has not regained it. The close sits just above 150,253, with 148,428 and 146,603 the next marks below and the shaded 143,982 band beneath those.
Marked levels. Above 153,3xx · 154,8xx · 156,832 · 158,348 · 159,864. Below 150,253 · 148,428 · 146,603 · 143,982.
GOLD SPOT (USD) — 15 September 2026
Close 4,301.750, up 2.230 (+0.05%) — essentially unchanged, against MCX gold's −0.34% on the day and −1.35% on the week.
That gap is the point of showing both. The dollar price of gold did nothing today; the rupee contract fell. A move that appears in one and not the other is not a move in the metal, and the two charts are here so that distinction is visible rather than assumed.
Spot is pressing the descending line off the late-August high, with 4,311.040 immediately overhead — the same line MCX is still below. The shaded band at roughly 4,000–4,060 is the nearest structure beneath.
Read across the session
These two sessions are near-mirror images, which is the most useful thing on this page. They are consecutive: Monday the 14th was a holiday, so Friday the 11th is the session immediately before this one.
| 11 Sep | 15 Sep | Closed | |
|---|---|---|---|
| Sensex | −0.16% | −1.04% | on the low |
| Nifty 50 | −0.34% | −1.19% | on the low |
| Bank Nifty | +0.24% | −1.43% | on the low |
| Nifty Midcap Select | +0.39% | −2.18% | on the low |
On the 11th every index made its low and closed well off it, the midcap index and Bank Nifty finishing green. Today every index opened near its high and closed on its low, with no recovery in any of them — and the order has inverted: the two that were strongest on Friday were the two weakest today.
Against that, crude oil rose 7.22% on the week on the heaviest volume visible on its chart, while MCX gold fell 1.35% and gold in dollars was flat. Equities down together, energy sharply up, and the metal flat-to-lower in rupee terms — the four equity indices moved as one today, and the commodities did not move with them.
What the institutional cash flow did on the same two days
The EOD cash figures NSE publishes line up with the shape of the two charts rather than cutting against it.
| FII net | DII net | Net of the two | DII cover of FII selling | |
|---|---|---|---|---|
| 11 Sep | −₹930.90 Cr | +₹1,968.17 Cr | +₹1,037.27 Cr | 2.11× |
| 15 Sep | −₹2,977.86 Cr | +₹2,686.05 Cr | −₹291.81 Cr | 0.90× |
On the 11th, domestic buying was a little over twice the foreign selling, and every index closed well off its low. Today foreign selling was more than three times Friday's and domestic buying did not cover it. 15 September is the only session this month on which it did not — every other September session with FII selling saw DII buying exceed it. It is also the second-largest single day of FII selling in September, behind 4 September's −₹3,111.94 Cr.
That is the same distinction the candles show. A session that closes well off its low and one that closes on its low differ by whether a bid turned up into the fall, and on these two days the published flow sits on the same side of that line as the price did.
And in derivatives
FII net position across index futures, index options, stock futures and stock options, comparing the two sessions:
| 11 Sep | 15 Sep | Change | |
|---|---|---|---|
| Index futures | −284,882 | −291,052 | −6,170 |
| Index options | −956,809 | −991,561 | −34,752 |
| Stock futures | +519,602 | +500,013 | −19,589 |
| Stock options | −430,255 | −441,251 | −10,996 |
| Net | −1,152,344 | −1,223,851 | −71,507 |
The short side grew by 71,507 contracts, and it grew in every bucket: added to index shorts, and the one net-long book — stock futures — reduced. So the cash selling was not offset by lighter positioning in derivatives; both moved the same way.
Three limits on reading this. These are net figures across all participants in a category, so they describe an aggregate and not any one desk. Two sessions is a comparison, not a trend. And flow published after the close cannot have caused the candles that made it — the two agreeing is worth noting precisely because they are measured independently, not because one explains the other.
Descriptive commentary on price structure and marked levels. It is not advice, not a recommendation, and contains no targets or entry levels. NEOGreeks is not a SEBI-registered investment adviser.