NIFTY 50 — 11 September 2026
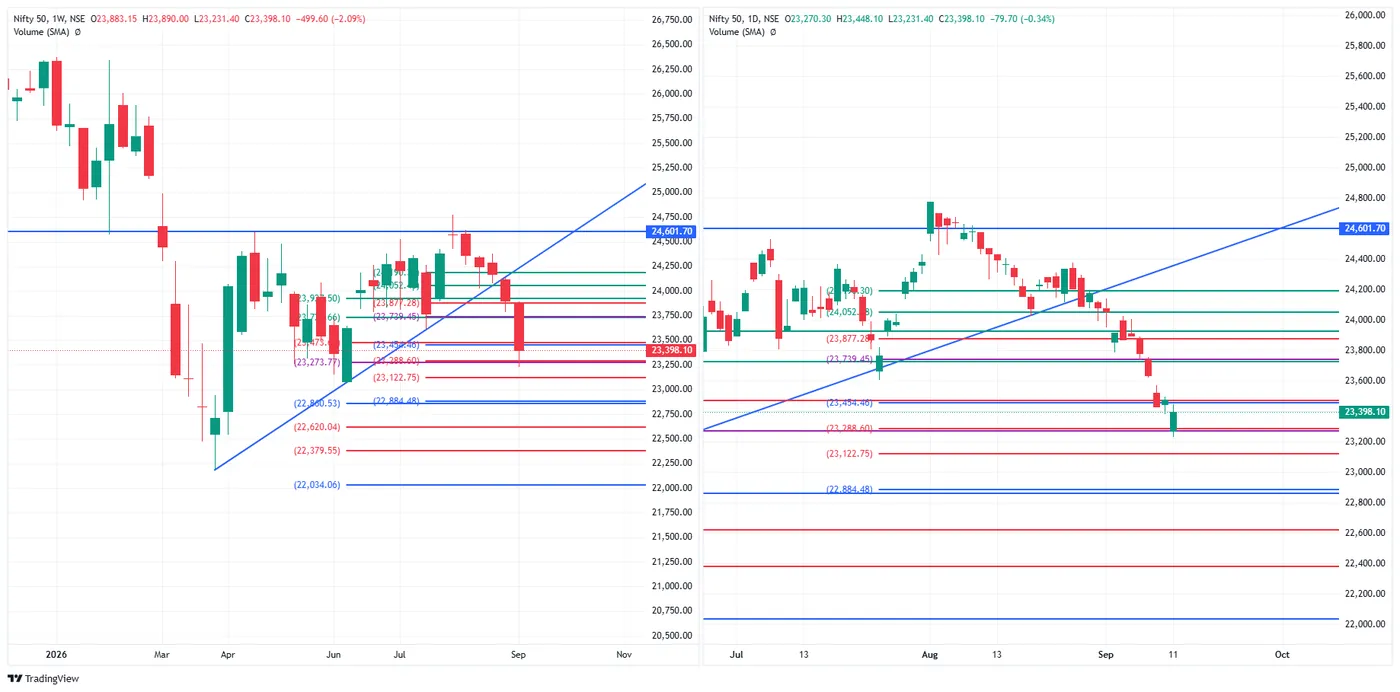
Close 23,398.10, down 79.70 (−0.34%) on the day and down 499.60 (−2.09%) on the week.
The weekly candle opened 23,883.15, traded 23,890.00 / 23,231.40 and closed in the lower quarter of its own range — the largest red weekly body in the sequence that began from the early-August highs.
The rising line off the April low near 22,250, which had contained every pullback through the May–July advance, is no longer holding price. Both timeframes now sit below it; on the daily that break happened in the first week of September and price has not traded back above it since. 24,601.70 remains the marked horizontal overhead — roughly 5.1% above this close, untested since early August.
Where price sits. Between 23,454.46 above and 23,288.60 below. The session low of 23,231.40 traded through the lower edge of that band and the close recovered inside it. The daily also closed above its own open (23,270.30 → 23,398.10) despite finishing lower on the day: the decline came at the open and was recovered during the session. That 23,231.40 was also the low of the week.
Marked levels. Overhead 23,454.46 · 23,739.45 · 23,877.28 · 24,052 · ~24,250 · 24,601.70. Below 23,288.60 · 23,122.75 · 22,884.48 · 22,620.04 · 22,379.55 · 22,034.06. The spacing is worth more than the list: six marks inside 1,200 points overhead, while below 23,122.75 the next is 22,884.48 — a ~240 point gap with nothing between, widening further beneath.
Structure. From the ~24,750 August high the daily has printed lower highs — early August, mid-August, and again around 24,050–24,200 at the end of the month — each stopping at or under a marked level. The September leg covered roughly 800 points in six sessions.
Weekly range was 658.60 points, about 2.8% of the close.
SENSEX — 11 September 2026
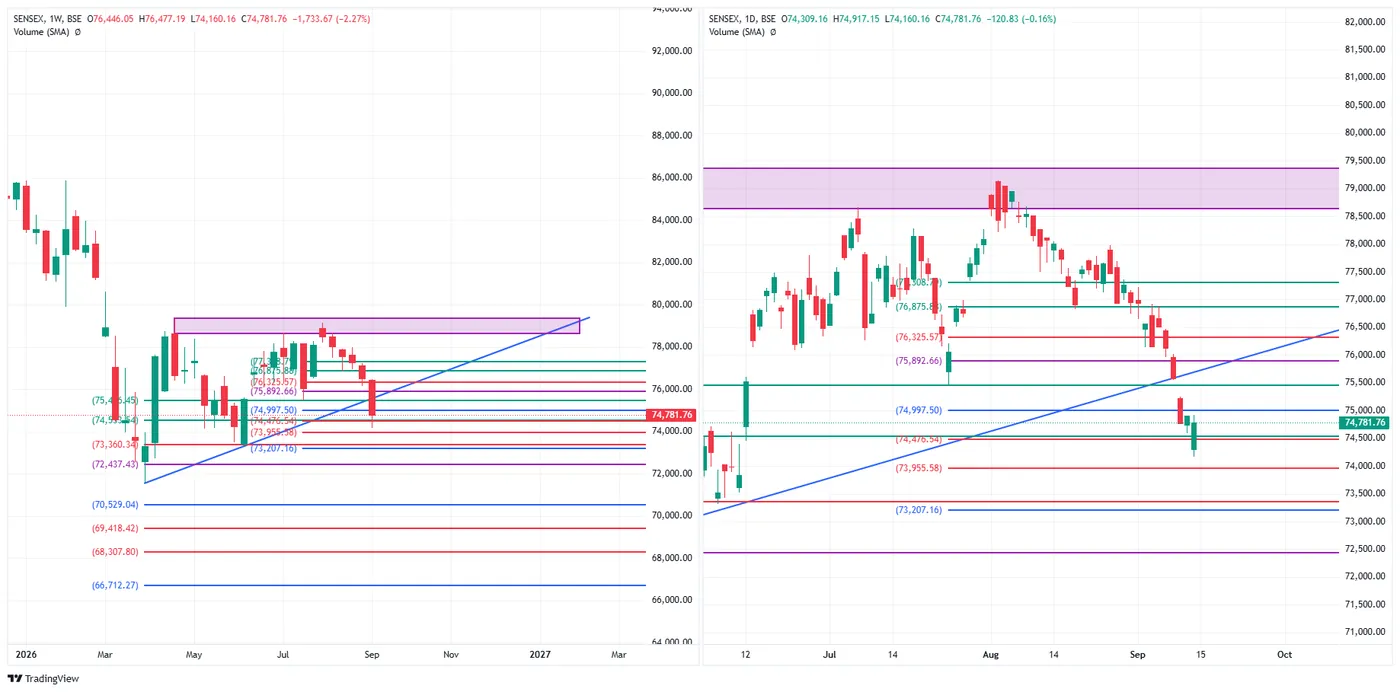
Close 74,781.76, down 120.83 (−0.16%) on the day and down 1,733.67 (−2.27%) on the week — a slightly deeper weekly fall than the Nifty's −2.09%.
The shaded band across the top of both panes, roughly 78,400–79,550, is the early-August area where the advance stalled. Price has not returned to it since; the close sits about 5.0% below its lower edge.
As on the Nifty, the rising line off the April low near 70,000 has been broken and price is now beneath it on both timeframes.
Where price sits. Between 74,997.50 above and 74,476.54 below — a band about 520 points wide, with the close nearer its upper edge. The session low of 74,160.16 traded below that band before the close recovered into it, and that low was also the low of the week.
The daily candle closed above its own open (74,309.16 → 74,781.76) while still finishing lower on the day — the same shape as the Nifty's session, a gap lower that was bought back through the day rather than a close on the lows.
Marked levels. Overhead 74,997.50 · 75,892.66 · 76,325.57 · 76,875.8 · 77,308.7, then the 78,400–79,550 band. Below 74,476.54 · 73,955.58 · 73,207.16 · 72,437.43, and on the weekly further out at 70,529.04 · 69,418.42 · 68,307.80 · 66,712.27.
Structure. The same sequence of lower highs the Nifty shows — the August peak inside the shaded band, then progressively lower stalls through mid-August and late August around 76,900–77,300, before the September leg. Weekly range was 2,317.03 points, about 3.1% of the close, wider in percentage terms than the Nifty's 2.8%.
NIFTY MIDCAP SELECT — 11 September 2026
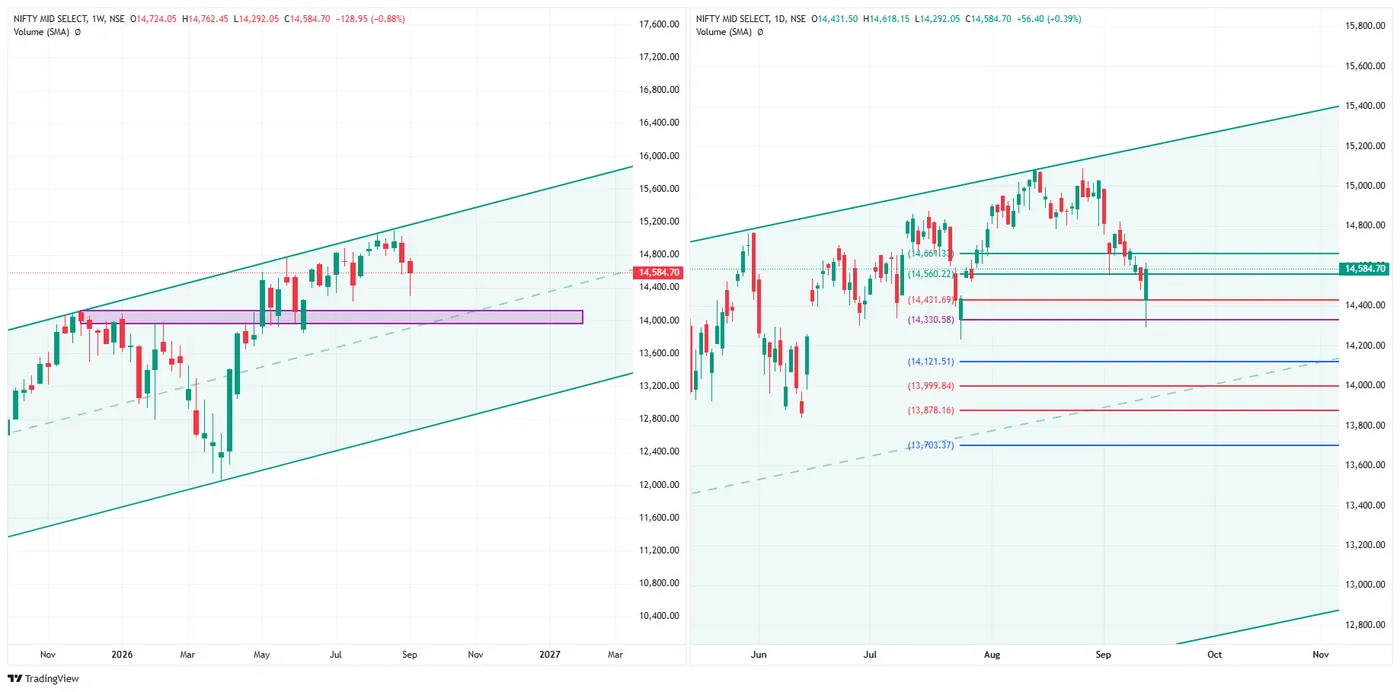
Close 14,584.70, up 56.40 (+0.39%) on the day and down 128.95 (−0.88%) on the week. Both of those numbers separate it from the large-cap indices this session: it is the only one of the three that closed the day higher, and its weekly fall was roughly a third of theirs.
The channel is intact. Where the Nifty and Sensex are trading below the rising lines drawn off their April lows, the midcap index is still inside its rising channel on both timeframes, in the upper half of it, with the dashed median line well below price. Nothing on this chart has broken.
Where price sits. Just above 14,560.22, with 14,661.33 the next mark overhead. The session low of 14,292.05 traded through 14,330.58 before the close recovered more than 290 points off it — and unlike the large caps, the recovery carried the close into positive territory rather than merely back above the open. That low was also the low of the week.
Marked levels. Overhead 14,661.33. Below 14,560.22 · 14,431.69 · 14,330.58 · 14,121.51 · 13,999.84 · 13,878.16 · 13,703.37. Note how much denser the marks are beneath price here than on the Nifty — seven inside about 880 points — and that the purple band around 13,980–14,100 on the weekly has been revisited repeatedly since December rather than cut through.
Structure. The daily high came in mid-August near 15,700, and the pullback since has covered roughly 1,400 points. That is a larger fall in percentage terms than either large-cap index has had from its own August high, which is worth holding alongside the weekly comparison above — a smaller fall this week is not the same as a smaller fall overall.
Weekly range was 470.40 points, about 3.2% of the close — wider in percentage terms than both the Sensex (3.1%) and the Nifty (2.8%).
BANK NIFTY — 11 September 2026
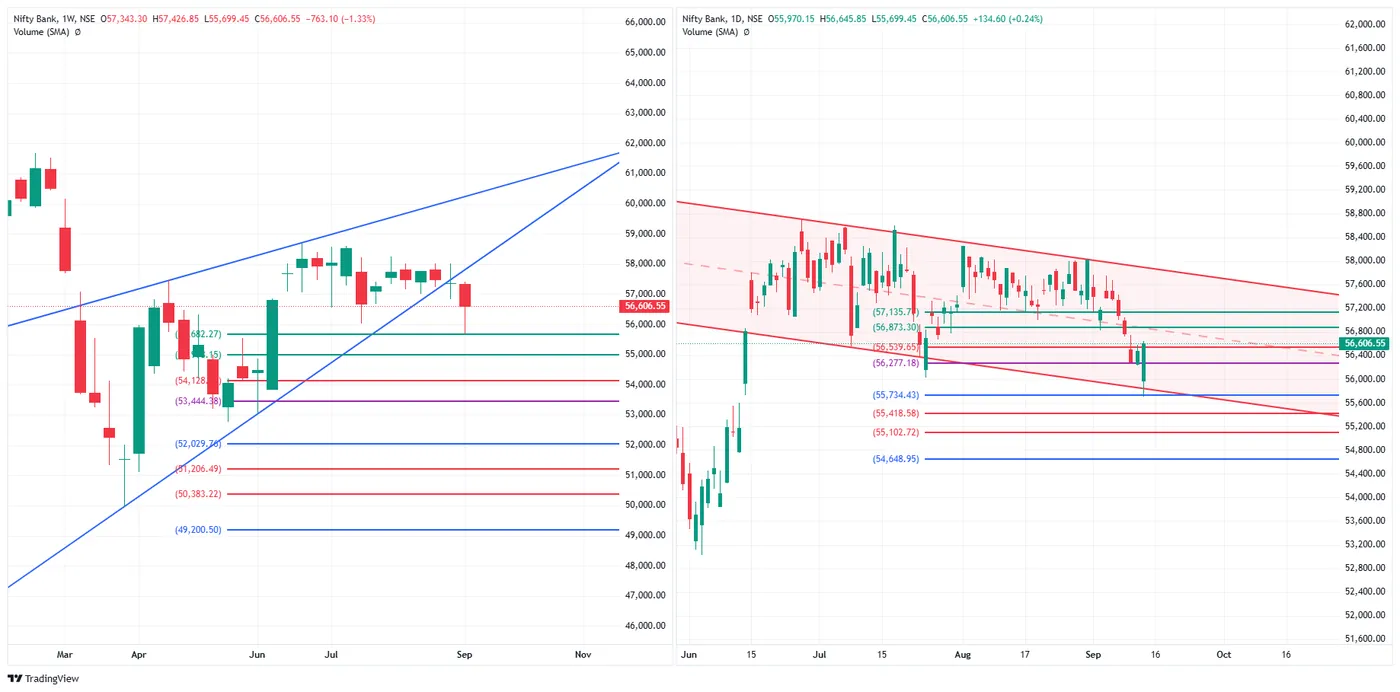
Close 56,606.55, up 134.60 (+0.24%) on the day and down 763.10 (−1.33%) on the week.
A third structure again. The Nifty and Sensex are below broken rising lines; the midcap index is inside an intact rising channel. Bank Nifty is inside a descending channel on the daily — the boundaries slope down, and price has been working along them since the June highs. It is neither holding an uptrend nor breaking one; it is inside a range that is itself drifting lower.
Where price sits. Just above 56,539.65, with 56,873.30 and 57,135.7 the marks overhead. The close sits under the channel's dashed median.
The session's low is the number worth keeping. 55,699.45 — the low of the week as well as the day — traded down to the channel's lower boundary, and the close came back 907 points, or 1.6%, off it. That is by some distance the largest recovery off the low of the four indices, and it turned the day green from an open of 55,970.15.
Marked levels. Overhead 56,873.30 · 57,135.7. Below 56,539.65 · 56,277.18 · 55,734.43 · 55,418.58 · 55,102.72 · 54,648.95, and on the weekly further out at 53,444.38 · 52,029.76 · 51,206.49 · 50,383.22 · 49,200.50.
The weekly range was 1,727.40 points, about 3.1% of the close.
Read across the four
The four indices did not do the same thing this week, and the spread between them is the most notable feature of the session.
| Day | Week | Structure | |
|---|---|---|---|
| Sensex | −0.16% | −2.27% | rising line from April broken |
| Nifty 50 | −0.34% | −2.09% | rising line from April broken |
| Bank Nifty | +0.24% | −1.33% | inside a descending channel |
| Nifty Midcap Select | +0.39% | −0.88% | rising channel intact |
Three different structures across four indices: two broken uptrends, one descending channel, one intact rising channel. They are not one market moving together this week.
Every one of them made its weekly low in this session and closed well off it. The size of that recovery orders cleanly:
| Low | Close | Off the low | |
|---|---|---|---|
| Nifty 50 | 23,231.40 | 23,398.10 | +0.72% |
| Sensex | 74,160.16 | 74,781.76 | +0.83% |
| Bank Nifty | 55,699.45 | 56,606.55 | +1.63% |
| Nifty Midcap Select | 14,292.05 | 14,584.70 | +2.05% |
The large caps recovered enough to close above their own opens while still finishing red; Bank Nifty and the midcap index recovered enough to close green.
Two cautions on reading that as broad-based strength. The midcap index has fallen further from its August high than either large cap has from theirs, so a smaller fall this week is not a smaller fall overall. And Bank Nifty's bounce came off the lower boundary of a channel that is still sloping down — the recovery is real, the structure it happened inside is not an uptrend.
What the institutional cash flow did on the same day
| FII net | DII net | Net of the two | |
|---|---|---|---|
| 11 Sep | −₹930.90 Cr | +₹1,968.17 Cr | +₹1,037.27 Cr |
Domestic buying was 2.11× the foreign selling, and this was the smallest day of FII selling in the four sessions before it. That is consistent with what the four charts show: every index made its weekly low in this session and closed well off it, two of them closing green.
The size of the bounce does not track the flow index by index, though — the published cash figures are a single market-wide number, not a per-index one, so they cannot explain why the midcap index recovered 2.05% off its low and the Nifty 0.72%. For that, the structures in the charts are the better guide: the midcap index bounced inside a rising channel that is still intact, the large caps beneath a broken line.
FII derivatives positioning at the close of this session stood at 284,882 contracts net short in index futures and 956,809 net short in index options, against a net long of 519,602 in stock futures — 1,152,344 contracts net short across the four books. These are net figures across all participants in a category, so they describe an aggregate rather than any one desk.
Descriptive commentary on price structure and marked levels. It is not advice, not a recommendation, and contains no targets or entry levels. NEOGreeks is not a SEBI-registered investment adviser.